Note
Access to this page requires authorization. You can try signing in or changing directories.
Access to this page requires authorization. You can try changing directories.
This article presents troubleshooting tips, remedial solutions, and best practices to address Document Intelligence latency issues. Latency refers to the duration an API server takes to handle and process an incoming request before delivering the response to the client. The time required to analyze a document varies based on its size (such as the number of pages) and the content on each page.
Document Intelligence operates as a multitenant service, ensuring that latency for similar documents is comparable, though not always identical. Variability in latency and performance is an inherent characteristic of any microservice-based, stateless, asynchronous service, especially when processing images and large documents on a large scale. Despite continuous efforts to increase hardware capacity and enhance scalability, some latency issues can still arise during runtime.
Note
- Azure AI services don't provide a Service Level Agreement (SLA) for latency.
- The Document Intelligence API offers asynchronous functionality, allowing you to access results up to 24 hours after sending your request to our backend.
- Use the request ID provided by the POST operation to retrieve these results. If you encounter issues during your standard polling sequence, save the request ID and try again later before considering a retry. For further assistance, refer to our service page.
Set your latency baseline
To evaluate latency, you should first establish baseline metrics for your specific scenario. These metrics give you the expected end-to-end and server latency within the context of your application environment. Once you have these baseline metrics, it becomes easier to distinguish between expected and unexpected conditions.
Check Azure region status
When you're experiencing latency issues, the first step is to check Azure status for any current outages or issues that might impact your services.
All active events are listed under the
Current Impacttab.You can also check your resource in the host region. Go to Geography → Products And Services → AI + Machine Learning → Azure AI Document Intelligence and check the status for your region:


Check file size
Monitor the size of files you send via the request API. Processing larger files in parallel can result in increased processing times. Normalize your metric by measuring latency per page. If you observe sustained periods (exceeding one hour) where latency per page consistently surpasses 15 seconds, consider addressing the issue.
Check Azure Blob storage latency
The size of a request affects latency in Azure Storage operations. Larger operations take more time to complete due to the increased volume of data transferred over the network and processed by Azure Storage.
Azure Storage provides two latency metrics for block blobs in the Azure portal:
End-to-end (E2E) latency measures the interval from when Azure Storage receives the first packet of the request until Azure Storage receives a client acknowledgment on the last packet of the response.
Server latency measures the interval from when Azure Storage receives the last packet of the request until the first packet of the response is returned from Azure Storage.
To view latency metrics, navigate to your storage resource in the Azure portal:
On the left navigation window, select Insights from the Monitoring drop-down menu.
The insights tab opens a window that includes a chart showing both
E2EandServerlatency metrics:
For more information, see Latency in Blob storage.
Check monitoring metrics for your resource
Azure portal monitors offer insights into your applications to enhance their performance and availability. There are several tools that you can use to monitor your app's performance in the Azure portal:
On the Overview page, select Monitoring, select the time period, and review the Request latency metrics on page.

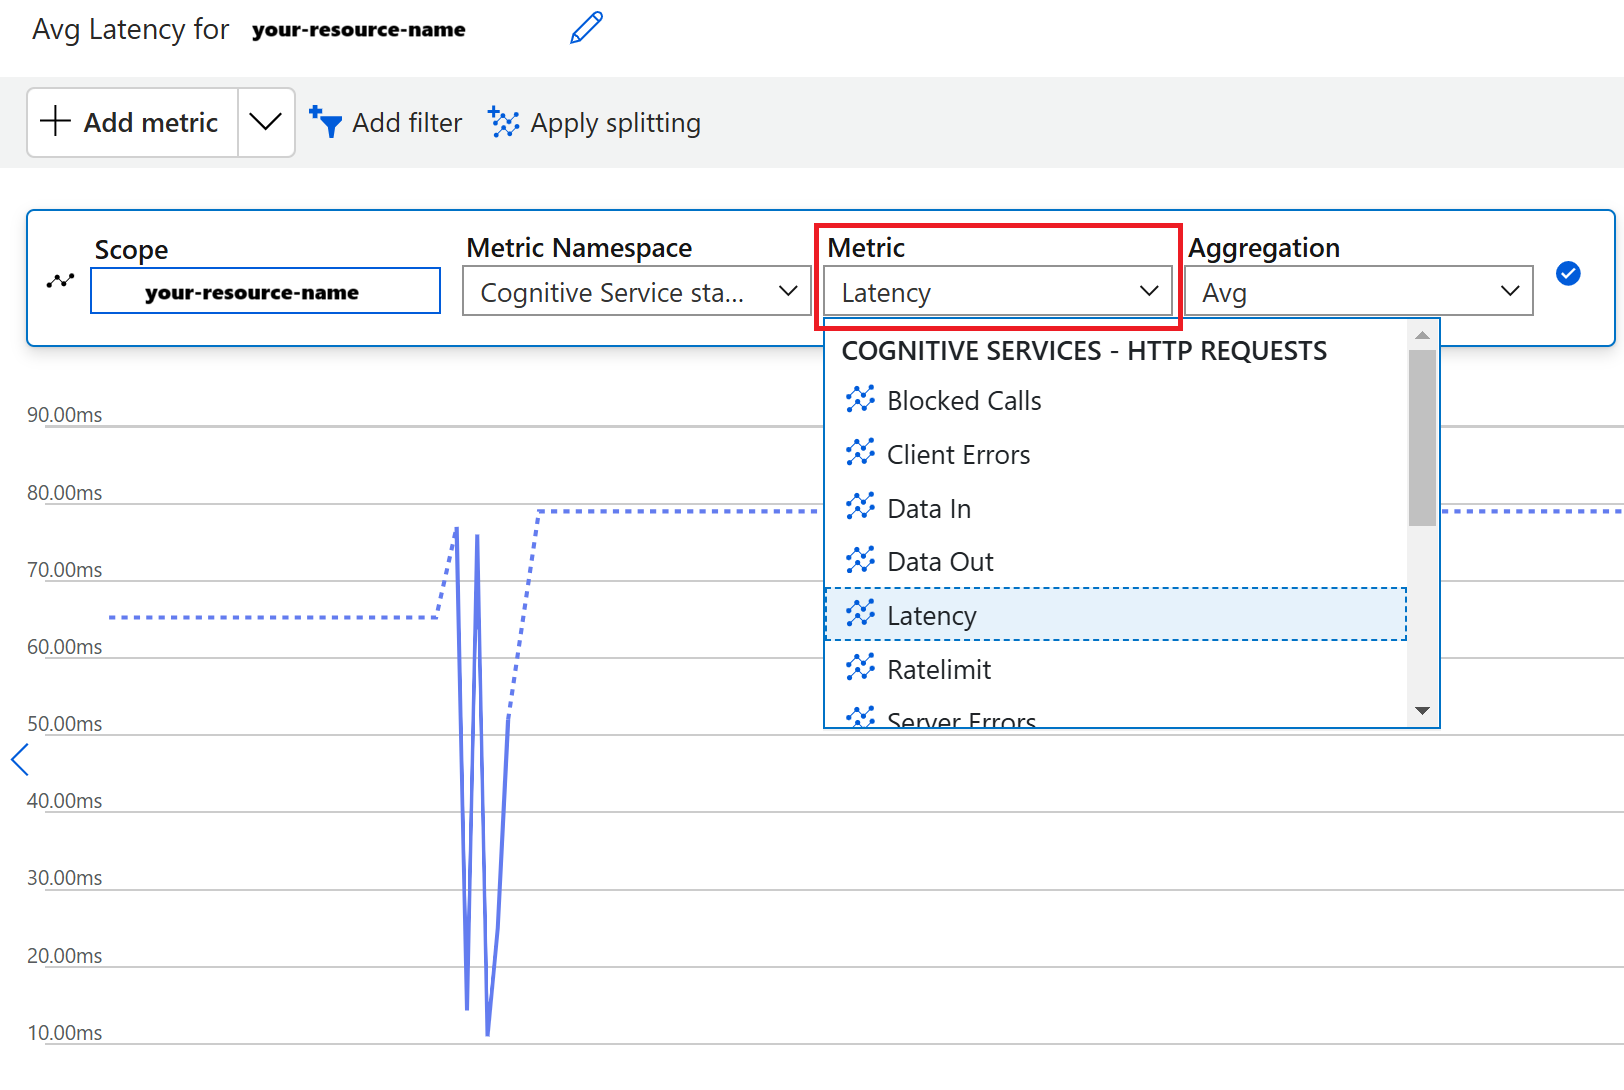
On the left navigation window, select Metrics from the Monitoring drop-down menu.
In the main window, select ➕Add metric.
Keep the Scope and Metric Namespace fields unchanged. Add the Latency parameter to the Metric field and adjust the Aggregation field as needed.
Set a latency alert in the Azure portal
Alerts assist you in identifying and resolving issues by providing proactive notifications when Azure Monitor data suggests a potential issue. An alert rule keeps an eye on your data and notifies you when set criteria are met on your specified resource. You can set up an alert in the Azure portal as follows:
On the left navigation window, select Alerts from the Monitoring drop-down menu.
Select the Create alert rule button.
In the new window that opens, select Latency from the Select a signal drop-down menu.
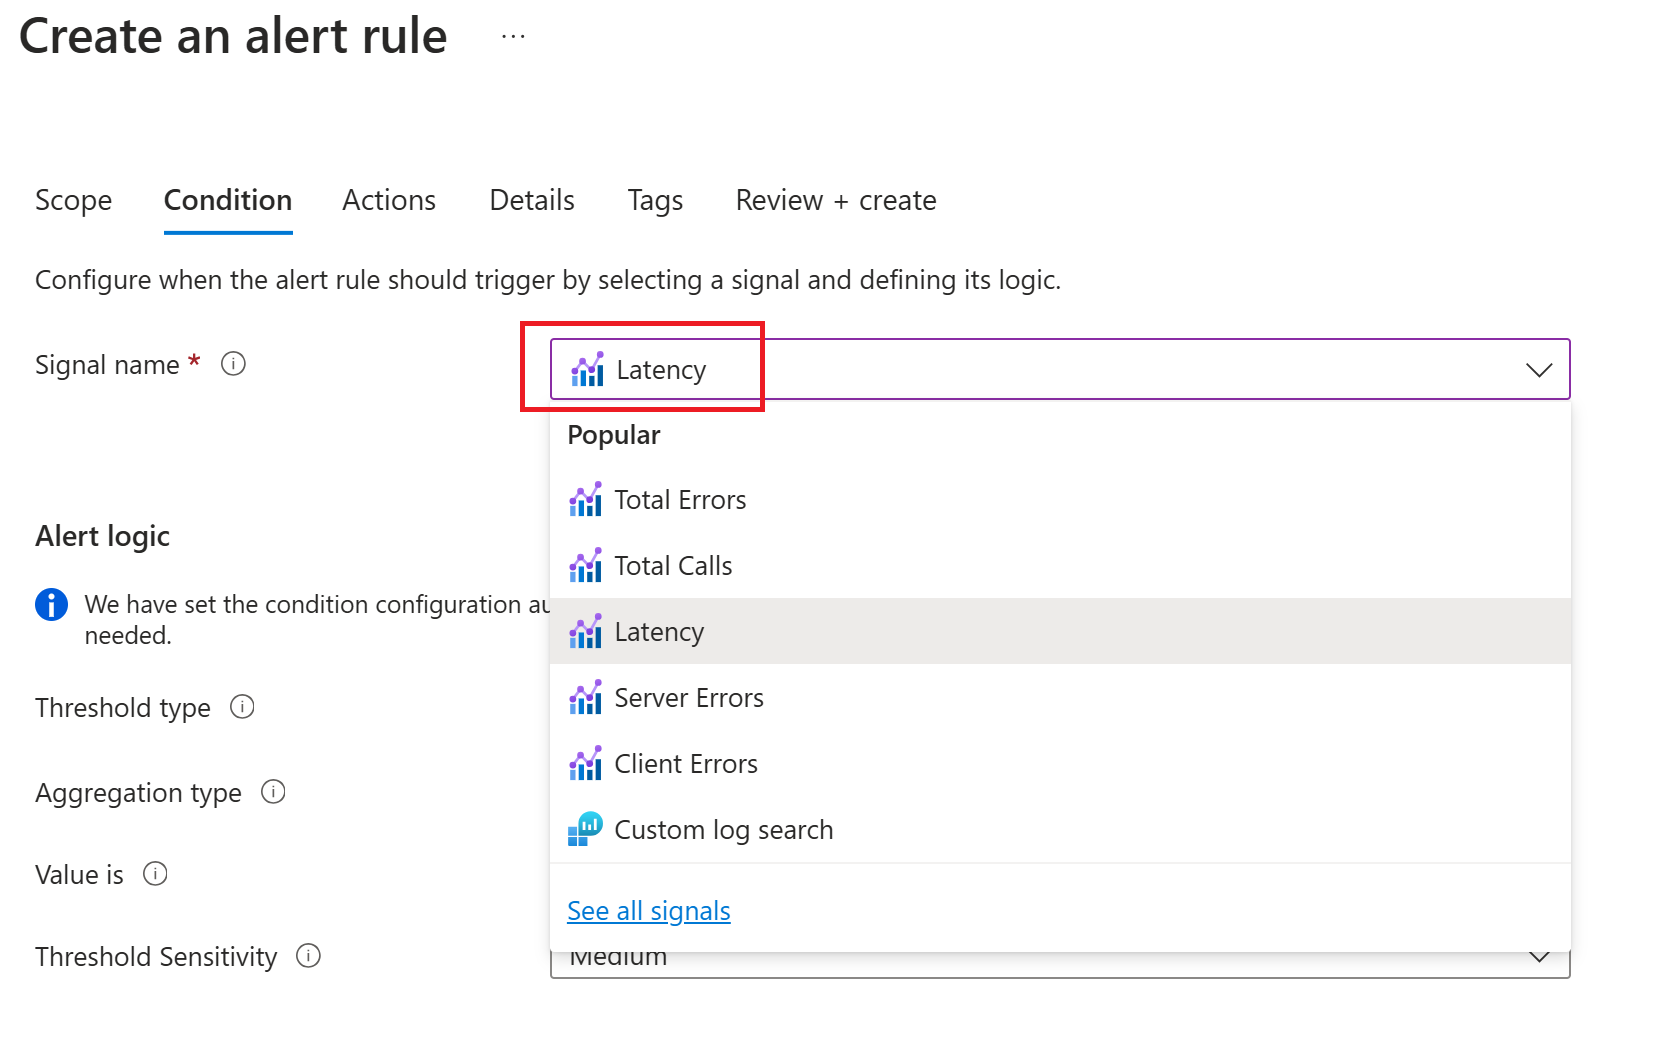
Configure the alert by completing the fields on the page.
After you complete the configuration, select Review ➕ create
Contact us
If you're unable to resolve long latency issue, email us with the following information:
Model Name
Version
Subscription ID
Resource ID
Timestamp and issue description
Request IDs of the concerning operations (if possible)
Logs
Sample files
JSON file (output/analyze results)
Training set (if it's a training issue related to custom neural models)
For more assistance, you can also or use the feedback widget at the bottom of any Learn page.