Note
Access to this page requires authorization. You can try signing in or changing directories.
Access to this page requires authorization. You can try changing directories.
In this article, you deploy a highly available PostgreSQL database on AKS.
- If you still need to create the required infrastructure for this deployment, follow the steps in Create infrastructure for deploying a highly available PostgreSQL database on AKS to get set up, and then return to this article.
Important
Open-source software is mentioned throughout AKS documentation and samples. Software that you deploy is excluded from AKS service-level agreements, limited warranty, and Azure support. As you use open-source technology alongside AKS, consult the support options available from the respective communities and project maintainers to develop a plan.
Microsoft takes responsibility for building the open-source packages that we deploy on AKS. That responsibility includes having complete ownership of the build, scan, sign, validate, and hotfix process, along with control over the binaries in container images. For more information, see Vulnerability management for AKS and AKS support coverage.
Create secret for bootstrap app user
- Generate a secret to validate the PostgreSQL deployment by interactive login for a bootstrap app user using the
kubectl create secretcommand.
Important
Microsoft recommends that you use the most secure authentication flow available. The authentication flow described in this procedure requires a high degree of trust in the application and carries risks that are not present in other flows. You should only use this flow when other more secure flows, such as managed identities, aren't viable.
PG_DATABASE_APPUSER_SECRET=$(echo -n | openssl rand -base64 16)

kubectl create secret generic db-user-pass \
    --from-literal=username=app \
     --from-literal=password="${PG_DATABASE_APPUSER_SECRET}" \
     --namespace $PG_NAMESPACE \
     --context $AKS_PRIMARY_CLUSTER_NAME
Validate that the secret was successfully created using the
kubectl getcommand.kubectl get secret db-user-pass --namespace $PG_NAMESPACE --context $AKS_PRIMARY_CLUSTER_NAME
Set environment variables for the PostgreSQL cluster
Deploy a ConfigMap to configure the CNPG operator using the following
kubectl applycommand. These values replace the legacyENABLE_AZURE_PVC_UPDATEStoggle, which is no longer required, and help stagger upgrades and speed up replica reconnections. Before rolling this configuration into production, validate that any existingDRAIN_TAINTSsettings you rely on remain compatible with your Azure environment.cat <<EOF | kubectl apply --context $AKS_PRIMARY_CLUSTER_NAME -n $PG_NAMESPACE -f - apiVersion: v1 kind: ConfigMap metadata: name: cnpg-controller-manager-config data: CLUSTERS_ROLLOUT_DELAY: '120' STANDBY_TCP_USER_TIMEOUT: '10' EOF
Install the Prometheus PodMonitors
Prometheus scrapes CNPG using the recording rules stored in the CNPG GitHub samples repo. Because the operator-managed PodMonitor is being deprecated, create and manage the PodMonitor resource yourself so you can tailor it to your monitoring stack.
Add the Prometheus Community Helm repo using the
helm repo addcommand.helm repo add prometheus-community \ https://prometheus-community.github.io/helm-chartsUpgrade the Prometheus Community Helm repo and install it on the primary cluster using the
helm upgradecommand with the--installflag.helm upgrade --install \ --namespace $PG_NAMESPACE \ -f https://raw.githubusercontent.com/cloudnative-pg/cloudnative-pg/main/docs/src/samples/monitoring/kube-stack-config.yaml \ prometheus-community \ prometheus-community/kube-prometheus-stack \ --kube-context=$AKS_PRIMARY_CLUSTER_NAMECreate a PodMonitor for the cluster. The CNPG team is deprecating the operator-managed PodMonitor, so you now manage it directly:
cat <<EOF | kubectl apply --context $AKS_PRIMARY_CLUSTER_NAME --namespace $PG_NAMESPACE -f -
apiVersion: monitoring.coreos.com/v1
kind: PodMonitor
metadata:
  name: $PG_PRIMARY_CLUSTER_NAME
  namespace: ${PG_NAMESPACE}
  labels:
    cnpg.io/cluster: ${PG_PRIMARY_CLUSTER_NAME}
spec:
  selector:
    matchLabels:
      cnpg.io/cluster: ${PG_PRIMARY_CLUSTER_NAME}
  podMetricsEndpoints:
    - port: metrics
EOF
Create a federated credential
In this section, you create a federated identity credential for PostgreSQL backup to allow CNPG to use AKS workload identity to authenticate to the storage account destination for backups. The CNPG operator creates a Kubernetes service account with the same name as the cluster named used in the CNPG Cluster deployment manifest.
Get the OIDC issuer URL of the cluster using the
az aks showcommand.export AKS_PRIMARY_CLUSTER_OIDC_ISSUER="$(az aks show \ --name $AKS_PRIMARY_CLUSTER_NAME \ --resource-group $RESOURCE_GROUP_NAME \ --query "oidcIssuerProfile.issuerUrl" \ --output tsv)"Create a federated identity credential using the
az identity federated-credential createcommand.az identity federated-credential create \ --name $AKS_PRIMARY_CLUSTER_FED_CREDENTIAL_NAME \ --identity-name $AKS_UAMI_CLUSTER_IDENTITY_NAME \ --resource-group $RESOURCE_GROUP_NAME \ --issuer "${AKS_PRIMARY_CLUSTER_OIDC_ISSUER}" \ --subject system:serviceaccount:"${PG_NAMESPACE}":"${PG_PRIMARY_CLUSTER_NAME}" \ --audience api://AzureADTokenExchange
Deploy a highly available PostgreSQL cluster
In this section, you deploy a highly available PostgreSQL cluster using the CNPG Cluster custom resource definition (CRD).
Cluster CRD parameters
The following table outlines the key properties set in the YAML deployment manifest for the Cluster CRD:
| Property | Definition |
|---|---|
imageName |
Points to the CloudNativePG operand container image. Use ghcr.io/cloudnative-pg/postgresql:18-system-trixie with the in-core backup integration shown in this guide, or switch to 18-standard-trixie when you adopt the Barman Cloud plugin. |
inheritedMetadata |
Specific to the CNPG operator. The CNPG operator applies the metadata to every object related to the cluster. |
annotations |
Includes the DNS label required when exposing the cluster endpoints and enables alpha.cnpg.io/failoverQuorum for quorum-based failover. |
labels: azure.workload.identity/use: "true" |
Indicates that AKS should inject workload identity dependencies into the pods hosting the PostgreSQL cluster instances. |
topologySpreadConstraints |
Require different zones and different nodes with label "workload=postgres". |
resources |
Configures a Quality of Service (QoS) class of Guaranteed. In a production environment, these values are key for maximizing usage of the underlying node VM and vary based on the Azure VM SKU used. |
probes |
Replaces the legacy startDelay configuration. Streaming startup and readiness probes help ensure replicas are healthy before serving traffic. |
smartShutdownTimeout |
Allows long-running transactions to finish gracefully during updates instead of using aggressive stop delays. |
bootstrap |
Specific to the CNPG operator. Initializes with an empty app database. |
storage |
Defines the PersistentVolume settings for the database. With Azure managed disks, the simplified syntax keeps data and WAL on the same 64-GiB volume, which offers better throughput tiers on managed disks. Adjust if you need separate WAL volumes. |
postgresql.synchronous |
Replaces minSyncReplicas/maxSyncReplicas and lets you specify synchronous replication behavior using the newer schema. |
postgresql.parameters |
Specific to the CNPG operator. Maps settings for postgresql.conf, pg_hba.conf, and pg_ident.conf. The sample emphasizes observability and WAL retention defaults that suit the AKS workload identity scenario but should be tuned per workload. |
serviceAccountTemplate |
Contains the template needed to generate the service accounts and maps the AKS federated identity credential to the UAMI to enable AKS workload identity authentication from the pods hosting the PostgreSQL instances to external Azure resources. |
barmanObjectStore |
Specific to the CNPG operator. Configures the barman-cloud tool suite using AKS workload identity for authentication to the Azure Blob Storage object store. |
To further isolate PostgreSQL workloads, you can add a taint (for example, node-role.kubernetes.io/postgres=:NoSchedule) to your data plane nodes and replace the sample nodeSelector/tolerations with the values recommended by CloudNativePG. If you take this approach, label the nodes accordingly and confirm the AKS autoscaler policies align with your topology.
PostgreSQL performance parameters
PostgreSQL performance heavily depends on your cluster's underlying resources and workload. The following table provides baseline guidance for a three-node cluster running on Standard D4s v3 nodes (16-GiB memory). Treat these values as a starting point and adjust them once you understand your workload profile:
| Property | Recommended value | Definition |
|---|---|---|
wal_compression |
lz4 | Compresses full-page writes written in WAL file with specified method |
max_wal_size |
6 GB | Sets the WAL size that triggers a checkpoint |
checkpoint_timeout |
15 min | Sets the maximum time between automatic WAL checkpoints |
checkpoint_completion_target |
0.9 | Balances checkpoint work across the checkpoint window |
checkpoint_flush_after |
2 MB | Number of pages after which previously performed writes are flushed to disk |
wal_writer_flush_after |
2 MB | Amount of WAL written out by WAL writer that triggers a flush |
min_wal_size |
2 GB | Sets the minimum size to shrink the WAL to |
max_slot_wal_keep_size |
10 GB | Upper bound for WAL left to service replication slots |
shared_buffers |
4 GB | Sets the number of shared memory buffers used by the server (25% of node memory in this example) |
effective_cache_size |
12 GB | Sets the planner's assumption about the total size of the data caches |
work_mem |
1/256th of node memory | Sets the maximum memory to be used for query workspaces |
maintenance_work_mem |
6.25% of node memory | Sets the maximum memory to be used for maintenance operations |
autovacuum_vacuum_cost_limit |
2400 | Vacuum cost amount available before napping, for autovacuum |
random_page_cost |
1.1 | Sets the planner's estimate of the cost of a nonsequentially fetched disk page |
effective_io_concurrency |
64 | Sets how many simultaneous requests the disk subsystem can handle efficiently |
maintenance_io_concurrency |
64 | A variant of "effective_io_concurrency" that is used for maintenance work |
Deploying PostgreSQL
Deploy the PostgreSQL cluster with the Cluster CRD using the
kubectl applycommand.cat <<EOF | kubectl apply --context $AKS_PRIMARY_CLUSTER_NAME -n $PG_NAMESPACE -v 9 -f - apiVersion: postgresql.cnpg.io/v1 kind: Cluster metadata: name: $PG_PRIMARY_CLUSTER_NAME annotations: alpha.cnpg.io/failoverQuorum: "true" spec: imageName: ghcr.io/cloudnative-pg/postgresql:18-system-trixie inheritedMetadata: annotations: service.beta.kubernetes.io/azure-dns-label-name: $AKS_PRIMARY_CLUSTER_PG_DNSPREFIX labels: azure.workload.identity/use: "true" instances: 3 smartShutdownTimeout: 30 probes: startup: type: streaming maximumLag: 32Mi periodSeconds: 5 timeoutSeconds: 3 failureThreshold: 120 readiness: type: streaming maximumLag: 0 periodSeconds: 10 failureThreshold: 6 topologySpreadConstraints: - maxSkew: 1 topologyKey: topology.kubernetes.io/zone whenUnsatisfiable: DoNotSchedule labelSelector: matchLabels: cnpg.io/cluster: $PG_PRIMARY_CLUSTER_NAME affinity: nodeSelector: workload: postgres resources: requests: memory: '8Gi' cpu: 2 limits: memory: '8Gi' cpu: 2 bootstrap: initdb: database: appdb owner: app secret: name: db-user-pass dataChecksums: true storage: storageClass: $POSTGRES_STORAGE_CLASS size: 64Gi postgresql: synchronous: method: any number: 1 parameters: wal_compression: lz4 max_wal_size: 6GB max_slot_wal_keep_size: 10GB checkpoint_timeout: 15min checkpoint_completion_target: '0.9' checkpoint_flush_after: 2MB wal_writer_flush_after: 2MB min_wal_size: 2GB shared_buffers: 4GB effective_cache_size: 12GB work_mem: 62MB maintenance_work_mem: 1GB autovacuum_vacuum_cost_limit: "2400" random_page_cost: "1.1" effective_io_concurrency: "64" maintenance_io_concurrency: "64" log_checkpoints: 'on' log_lock_waits: 'on' log_min_duration_statement: '1000' log_statement: 'ddl' log_temp_files: '1024' log_autovacuum_min_duration: '1s' pg_stat_statements.max: '10000' pg_stat_statements.track: 'all' hot_standby_feedback: 'on' pg_hba: - host all all all scram-sha-256 serviceAccountTemplate: metadata: annotations: azure.workload.identity/client-id: "$AKS_UAMI_WORKLOAD_CLIENTID" labels: azure.workload.identity/use: "true" backup: barmanObjectStore: destinationPath: "https://${PG_PRIMARY_STORAGE_ACCOUNT_NAME}.blob.core.chinacloudapi.cn/backups" azureCredentials: inheritFromAzureAD: true retentionPolicy: '7d' EOF
Note
The sample manifest uses the ghcr.io/cloudnative-pg/postgresql:18-system-trixie image because it works with the in-core Barman Cloud integration shown later. When you're ready to switch to the Barman Cloud plugin, update spec.imageName to ghcr.io/cloudnative-pg/postgresql:18-standard-trixie and follow the plugin configuration guidance before redeploying the cluster.
Important
The example pg_hba entry allows non-TLS access. If you keep this configuration, document the security implications for your team and prefer encrypted connections wherever possible.
Validate that the primary PostgreSQL cluster was successfully created using the
kubectl getcommand. The CNPG Cluster CRD specified three instances, which can be validated by viewing running pods once each instance is brought up and joined for replication. Be patient as it can take some time for all three instances to come online and join the cluster.kubectl get pods --context $AKS_PRIMARY_CLUSTER_NAME --namespace $PG_NAMESPACE -l cnpg.io/cluster=$PG_PRIMARY_CLUSTER_NAMEExample output
NAME                         READY   STATUS    RESTARTS   AGE
pg-primary-cnpg-r8c7unrw-1   1/1     Running   0          4m25s
pg-primary-cnpg-r8c7unrw-2   1/1     Running   0          3m33s
pg-primary-cnpg-r8c7unrw-3   1/1     Running   0          2m49s
Important
If you use local NVMe with Azure Container Storage and a pod remains in the init state with a multi-attach error, the pod is still searching for the volume on a lost node. After the pod starts running, it enters a CrashLoopBackOff state because CNPG creates a new replica on a new node without data and can't find the pgdata directory. To resolve this issue, destroy the affected instance and bring up a new one. Run the following command:
kubectl cnpg destroy [cnpg-cluster-name] [instance-number]
Validate the Prometheus PodMonitor is running
The manually created PodMonitor ties the kube-prometheus-stack scrape configuration to the CNPG pods you deployed earlier.
Validate the PodMonitor is running using the kubectl get command.
kubectl --namespace $PG_NAMESPACE \
    --context $AKS_PRIMARY_CLUSTER_NAME \
    get podmonitors.monitoring.coreos.com \
    $PG_PRIMARY_CLUSTER_NAME \
    --output yaml
Example output
kind: PodMonitor
metadata:
  labels:
    cnpg.io/cluster: pg-primary-cnpg-r8c7unrw
  name: pg-primary-cnpg-r8c7unrw
  namespace: cnpg-database
spec:
  podMetricsEndpoints:
  - port: metrics
  selector:
    matchLabels:
      cnpg.io/cluster: pg-primary-cnpg-r8c7unrw
If you're using Azure Monitor for Managed Prometheus, you need to add another pod monitor using the custom group name. Managed Prometheus doesn't pick up the custom resource definitions (CRDs) from the Prometheus community. Aside from the group name, the CRDs are the same. That design lets pod monitors for Managed Prometheus run alongside pod monitors that use the community CRD. If you're not using Managed Prometheus, you can skip this section. Create a new pod monitor:
cat <<EOF | kubectl apply --context $AKS_PRIMARY_CLUSTER_NAME --namespace $PG_NAMESPACE -f -
apiVersion: azmonitoring.coreos.com/v1
kind: PodMonitor
metadata:
  name: cnpg-cluster-metrics-managed-prometheus
  namespace: ${PG_NAMESPACE}
  labels:
    azure.workload.identity/use: "true"
    cnpg.io/cluster: ${PG_PRIMARY_CLUSTER_NAME}
spec:
  selector:
    matchLabels:
      azure.workload.identity/use: "true"
      cnpg.io/cluster: ${PG_PRIMARY_CLUSTER_NAME}
  podMetricsEndpoints:
    - port: metrics
EOF
Verify that the pod monitor is created (note the difference in the group name).
kubectl --namespace $PG_NAMESPACE \
    --context $AKS_PRIMARY_CLUSTER_NAME \
    get podmonitors.azmonitoring.coreos.com \
    -l cnpg.io/cluster=$PG_PRIMARY_CLUSTER_NAME \
    -o yaml
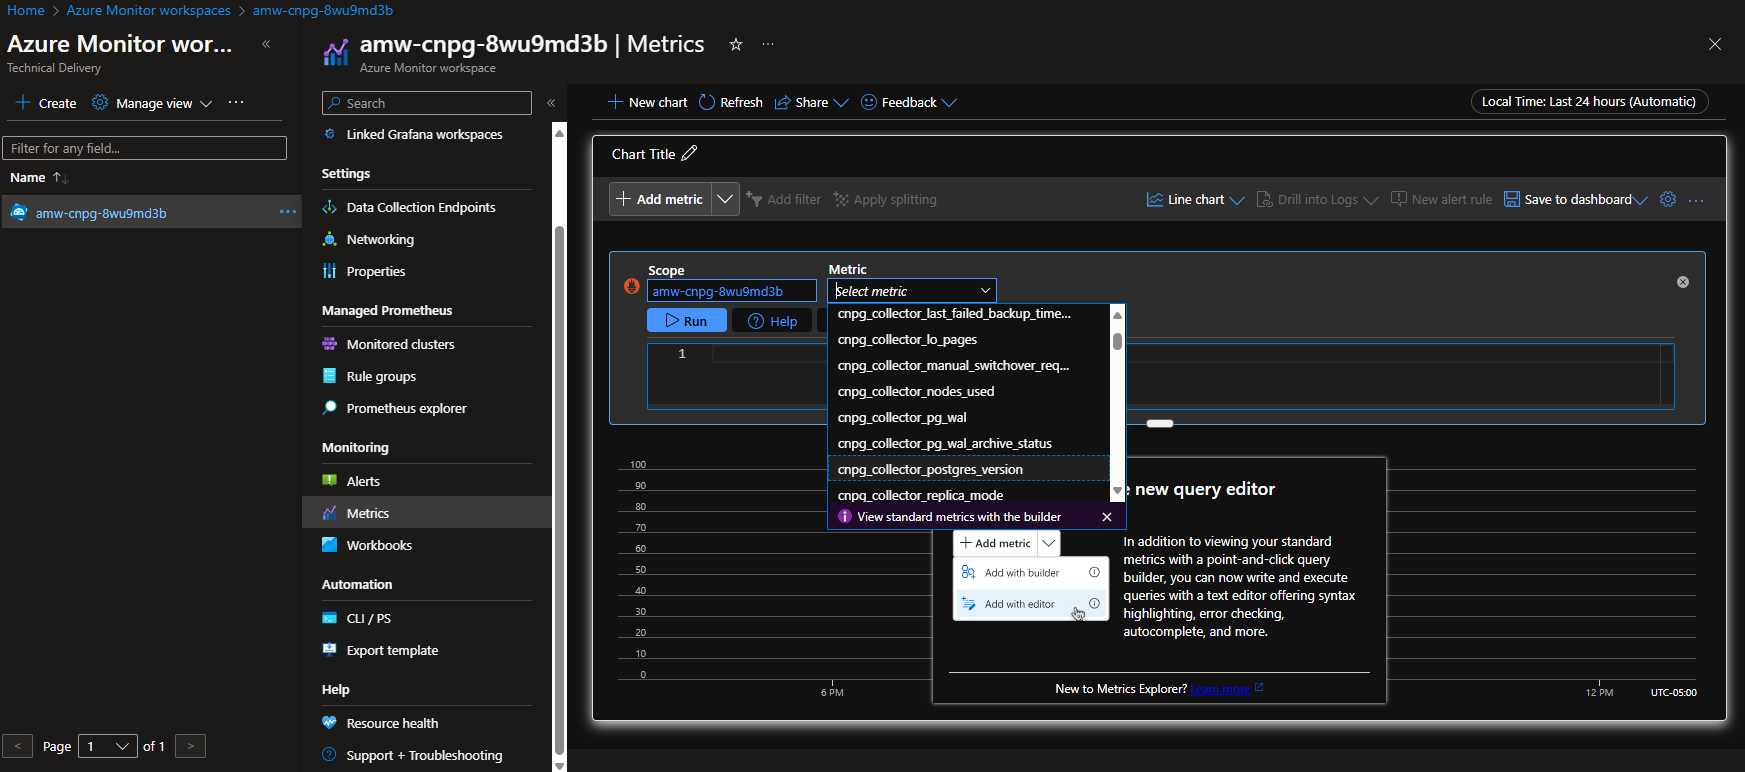
Option A - Azure Monitor workspace
After you deploy the Postgres cluster and the pod monitor, you can view the metrics using the Azure portal in an Azure Monitor workspace.
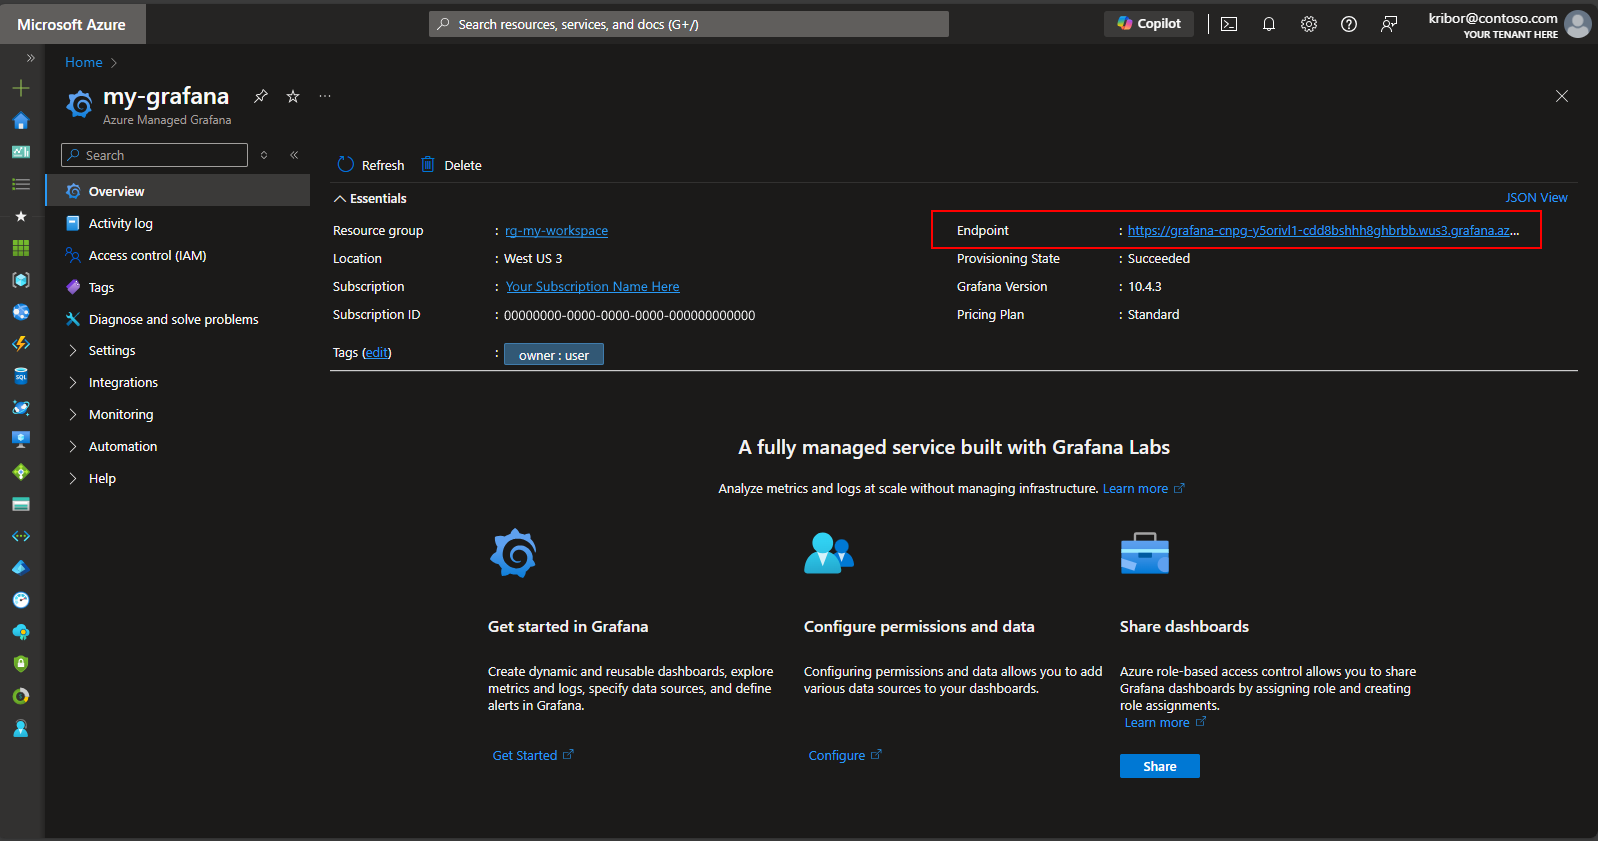
Option B - Managed Grafana
Alternatively, after you deploy the Postgres cluster and pod monitors, you can create a metrics dashboard on the Managed Grafana instance created by the deployment script to visualize the metrics exported to the Azure Monitor workspace. You can access the Managed Grafana via the Azure portal. Navigate to the Managed Grafana instance created by the deployment script and select the Endpoint link as shown here:
Selecting the Endpoint link opens a new browser window where you can create dashboards on the Managed Grafana instance. Following the instructions to configure an Azure Monitor data source, you can then add visualizations to create a dashboard of metrics from the Postgres cluster. After setting up the data source connection, from the main menu, select the Data sources option. You should see a set of data source options for the data source connection as shown here:
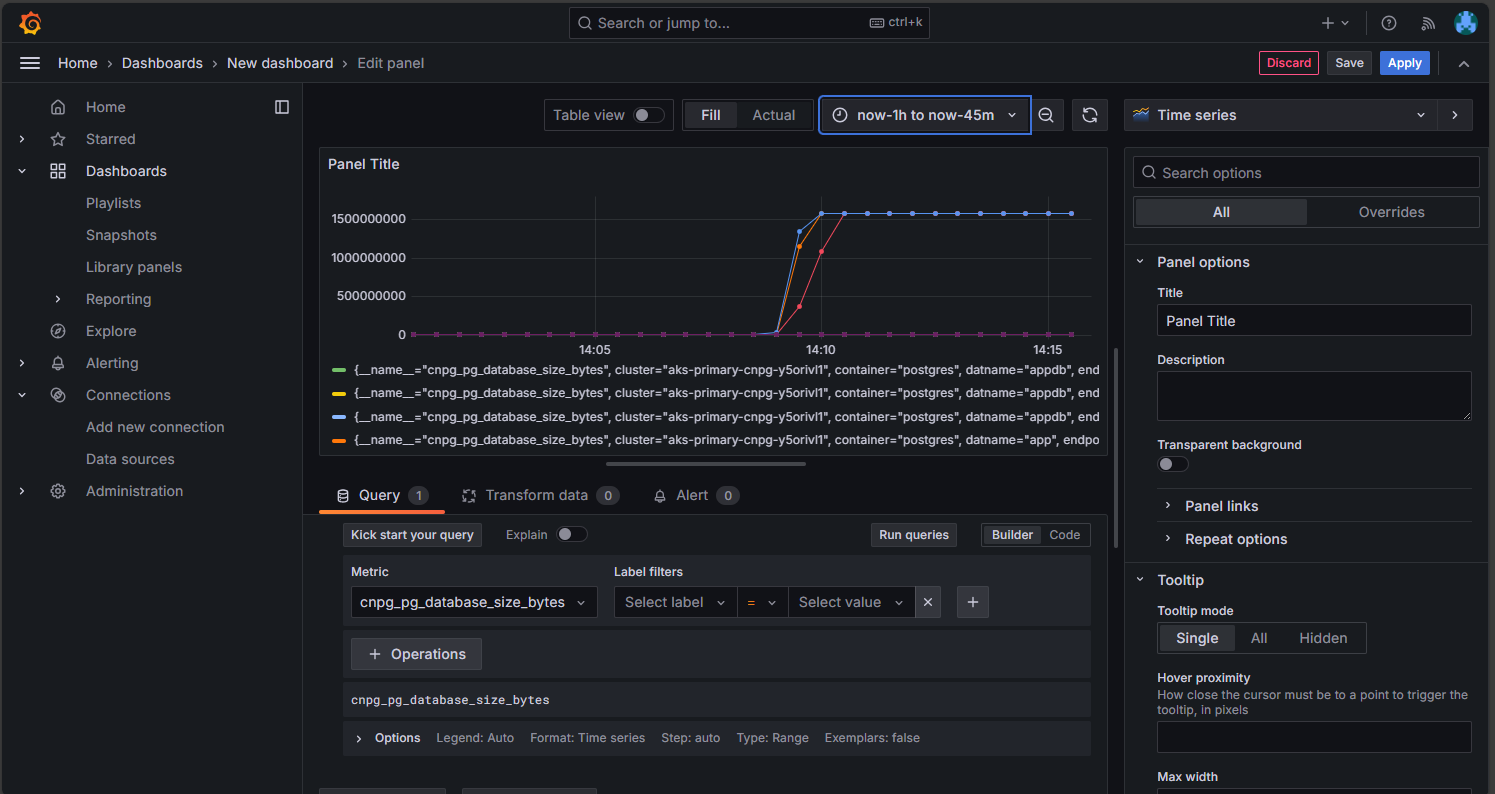
On the Managed Prometheus option, select the option to build a dashboard to open the dashboard editor. After the editor window opens, select the Add visualization option then select the Managed Prometheus option to browse the metrics from the Postgres cluster. After you select the metric you want to visualize, select the Run queries button to fetch the data for the visualization as shown here:
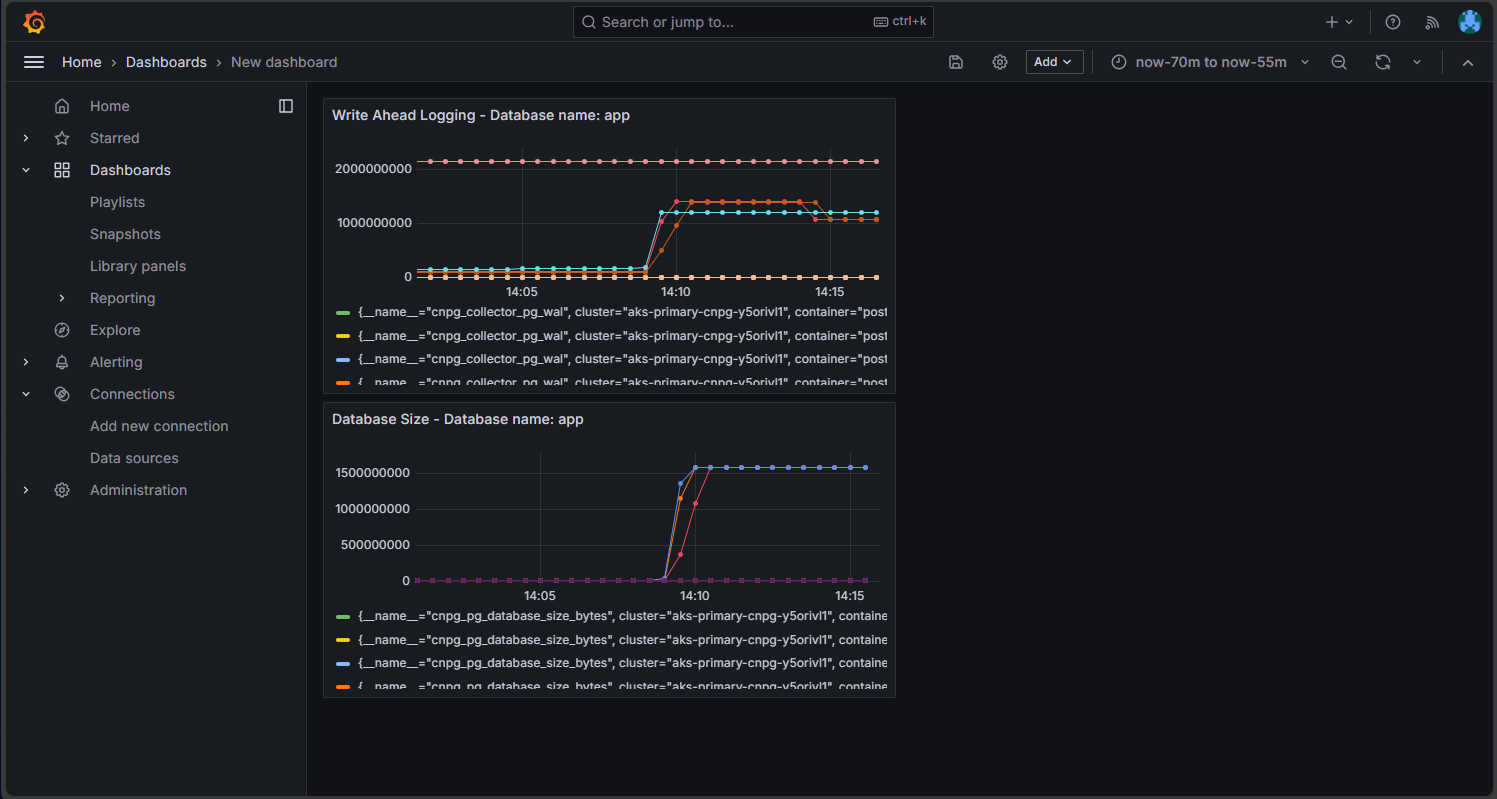
Select the Save icon to add the panel to your dashboard. You can add other panels by selecting the Add button in the dashboard editor and repeating this process to visualize other metrics. Adding the metrics visualizations, you should have something that looks like this:
Select the Save icon to save your dashboard.
Next steps
Contributors
Microsoft maintains this article. The following contributors originally wrote it:
- Ken Kilty | Principal TPM
- Russell de Pina | Principal TPM
- Adrian Joian | Senior Customer Engineer
- Jenny Hayes | Senior Content Developer
- Carol Smith | Senior Content Developer
- Erin Schaffer | Content Developer 2
- Adam Sharif | Customer Engineer 2
Acknowledgment
This documentation was jointly developed with EnterpriseDB, the maintainers of the CloudNativePG operator. We thank Gabriele Bartolini for reviewing earlier drafts of this document and offering technical improvements.


