Note
Access to this page requires authorization. You can try signing in or changing directories.
Access to this page requires authorization. You can try changing directories.
Cloud services, Virtual Machines, Virtual Machine Scale Sets and Service Fabric all use the Azure Diagnostics extension to collect data. Azure diagnostics sends data to Azure Storage tables. However, you can also pipe all or a subset of the data to other locations using Azure Diagnostics extension 1.5 or later.
This article describes how to send data from the Azure Diagnostics extension to Application Insights.
Important
Azure Diagnostics extension was deprecated on March 31, 2026 and is no longer supported. New deployments of the extension aren't recommended. To ensure continued support and access to new features, migrate to the alternative solutions recommended here.
Diagnostics configuration explained
The Azure diagnostics extension 1.5 introduced sinks, which are extra locations where you can send diagnostic data.
Example configuration of a sink for Application Insights:
<SinksConfig>
    <Sink name="ApplicationInsights">
      <ApplicationInsights>{Insert ConnectionString}</ApplicationInsights>
      <Channels>
        <Channel logLevel="Error" name="MyTopDiagData"  />
        <Channel logLevel="Verbose" name="MyLogData"  />
      </Channels>
    </Sink>
</SinksConfig>
"SinksConfig": {
    "Sink": [
        {
            "name": "ApplicationInsights",
            "ApplicationInsights": "{Insert ConnectionString}",
            "Channels": {
                "Channel": [
                    {
                        "logLevel": "Error",
                        "name": "MyTopDiagData"
                    },
                    {
                        "logLevel": "Error",
                        "name": "MyLogData"
                    }
                ]
            }
        }
    ]
}
The Sink name attribute is a string value that uniquely identifies the sink.
The ApplicationInsights element specifies the connection string of the Application insights resource where the Azure diagnostics data is sent.
- If you don't have an existing Application Insights resource, see Create a new Application Insights resource.
- If you're developing a Cloud Service with Azure SDK 2.8 and later, the connection string is automatically populated. The value is based on the APPLICATIONINSIGHTS_CONNECTION_STRING service configuration setting when packaging the Cloud Service project, see Use Application Insights with Cloud Services.
The Channels element contains one or more Channel elements.
- The name attribute uniquely refers to that channel.
- The loglevel attribute lets you specify the log level that the channel allows. The available log levels in order of most to least information are:
- Verbose
- Information
- Warning
- Error
- Critical
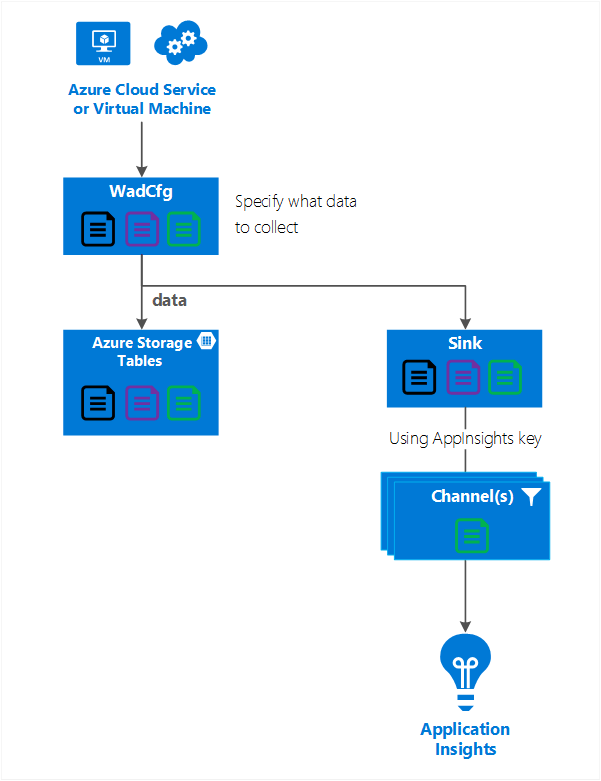
A channel acts like a filter and allows you to select specific log levels to send to the target sink. For example, you could collect verbose logs and send them to storage, but send only Errors to the sink.
The following graphic shows this relationship.
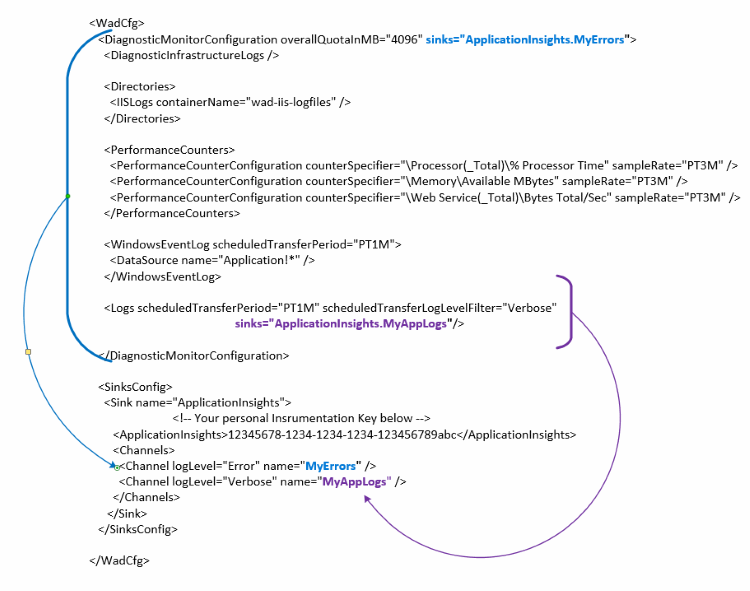
The following graphic summarizes the configuration values and how they work. You can include multiple sinks in the configuration at different levels in the hierarchy. The sink at the top level acts as a global setting and the one specified at the individual element acts like an override to that global setting.
Complete sink configuration example
Here's a complete example of the public configuration file that:
- Sends all errors to Application Insights (specified at the DiagnosticMonitorConfiguration node).
- Also sends Verbose level logs for the Application Logs (specified at the Logs node).
<WadCfg>
  <DiagnosticMonitorConfiguration overallQuotaInMB="4096"
       sinks="ApplicationInsights.MyTopDiagData"> <!-- All info below sent to this channel -->
    <DiagnosticInfrastructureLogs />
    <PerformanceCounters>
      <PerformanceCounterConfiguration counterSpecifier="\Processor(_Total)\% Processor Time" sampleRate="PT3M" />
      <PerformanceCounterConfiguration counterSpecifier="\Memory\Available MBytes" sampleRate="PT3M" />
    </PerformanceCounters>
    <WindowsEventLog scheduledTransferPeriod="PT1M">
      <DataSource name="Application!*" />
    </WindowsEventLog>
    <Logs scheduledTransferPeriod="PT1M" scheduledTransferLogLevelFilter="Verbose"
            sinks="ApplicationInsights.MyLogData"/> <!-- This specific info sent to this channel -->
  </DiagnosticMonitorConfiguration>

<SinksConfig>
    <Sink name="ApplicationInsights">
      <ApplicationInsights>{Insert ConnectionString}</ApplicationInsights>
      <Channels>
        <Channel logLevel="Error" name="MyTopDiagData"  />
        <Channel logLevel="Verbose" name="MyLogData"  />
      </Channels>
    </Sink>
  </SinksConfig>
</WadCfg>
"WadCfg": {
    "DiagnosticMonitorConfiguration": {
        "overallQuotaInMB": 4096,
        "sinks": "ApplicationInsights.MyTopDiagData", "_comment": "All info below sent to this channel",
        "DiagnosticInfrastructureLogs": {
        },
        "PerformanceCounters": {
            "PerformanceCounterConfiguration": [
                {
                    "counterSpecifier": "\\Processor(_Total)\\% Processor Time",
                    "sampleRate": "PT3M"
                },
                {
                    "counterSpecifier": "\\Memory\\Available MBytes",
                    "sampleRate": "PT3M"
                }
            ]
        },
        "WindowsEventLog": {
            "scheduledTransferPeriod": "PT1M",
            "DataSource": [
                {
                    "name": "Application!*"
                }
            ]
        },
        "Logs": {
            "scheduledTransferPeriod": "PT1M",
            "scheduledTransferLogLevelFilter": "Verbose",
            "sinks": "ApplicationInsights.MyLogData", "_comment": "This specific info sent to this channel"
        }
    },
    "SinksConfig": {
        "Sink": [
            {
                "name": "ApplicationInsights",
                "ApplicationInsights": "{Insert ConnectionString}",
                "Channels": {
                    "Channel": [
                        {
                            "logLevel": "Error",
                            "name": "MyTopDiagData"
                        },
                        {
                            "logLevel": "Verbose",
                            "name": "MyLogData"
                        }
                    ]
                }
            }
        ]
    }
}
In the previous configuration, the following lines have the following meanings:
Send all the data Azure diagnostics collects
<DiagnosticMonitorConfiguration overallQuotaInMB="4096" sinks="ApplicationInsights">
"DiagnosticMonitorConfiguration": {
    "overallQuotaInMB": 4096,
    "sinks": "ApplicationInsights",
}
Send only error logs to the Application Insights sink
<DiagnosticMonitorConfiguration overallQuotaInMB="4096" sinks="ApplicationInsights.MyTopDiagdata">
"DiagnosticMonitorConfiguration": {
    "overallQuotaInMB": 4096,
    "sinks": "ApplicationInsights.MyTopDiagData",
}
Send Verbose application logs to Application Insights
<Logs scheduledTransferPeriod="PT1M" scheduledTransferLogLevelFilter="Verbose" sinks="ApplicationInsights.MyLogData"/>
"DiagnosticMonitorConfiguration": {
    "overallQuotaInMB": 4096,
    "sinks": "ApplicationInsights.MyLogData",
}
Limitations
- Channels only log type and not performance counters. If you specify a channel with a performance counter element, it's ignored.
- The log level for a channel can't exceed the log level for what is being collected by Azure diagnostics. For example, you can't collect Application Log errors in the Logs element and try to send Verbose logs to the Application Insight sink. The scheduledTransferLogLevelFilter attribute must always collect equal or more logs than the logs you're trying to send to a sink.
- You can't send blob data collected by Azure diagnostics extension to Application Insights. For example, anything specified under the Directories node. For Crash Dumps, the actual crash dump is sent to blob storage and only a notification that the crash dump was generated is sent to Application Insights.
Next Steps
- Learn how to view your Azure diagnostics information in Application Insights.
- Use PowerShell to enable the Azure diagnostics extension for your application.
- Use Visual Studio to enable the Azure diagnostics extension for your application.

