Note
Access to this page requires authorization. You can try signing in or changing directories.
Access to this page requires authorization. You can try changing directories.
Application Insights automatically alerts you in near real time if your web app experiences an abnormal rise in the rate of failed requests. It detects an unusual rise in the rate of HTTP requests or dependency calls that are reported as failed. For requests, failed requests usually have response codes of 400 or higher. To help you triage and diagnose the problem, an analysis of the characteristics of the failures and related application data is provided in the alert details. There are also links to the Application Insights portal for further diagnosis. The feature needs no set-up nor configuration, as it uses machine learning algorithms to predict the normal failure rate.
This feature works for any web app, hosted in the cloud or on your own servers that generate application request or dependency data. For example, if you have a worker role that calls TrackRequest() or TrackDependency().
After setting up Application Insights for your project, and if your app generates a certain minimum amount of data, Smart Detection of Failure Anomalies takes 24 hours to learn the normal behavior of your app, before it's switched on and can send alerts.
Here's a sample alert:
Note
Smart Detector Failure Anomalies are calculated for the failure rates on the total requests in each App Insights. These notifications will not alert per API or application sending these requests.
The alert details tell you:
- The failure rate compared to normal app behavior.
- How many users are affected - so you know how much to worry.
- A characteristic pattern associated with the failures. In this example, there's a particular response code, request name (operation), and application version. That immediately tells you where to start looking in your code. Other possibilities could be a specific browser or client operating system.
- The exception, log traces, and dependency failure (databases or other external components) that appear to be associated with the characterized failures.
- Links directly to relevant searches on the data in Application Insights.
Benefits of Smart Detection
Ordinary metric alerts tell you there might be a problem. But Smart Detection starts the diagnostic work for you, performing much the analysis you would otherwise have to do yourself. You get the results neatly packaged, helping you to get quickly to the root of the problem.
How it works
Smart Detection monitors the data received from your app, and in particular the failure rates. This rule counts the number of requests for which the Successful request property is false, and the number of dependency calls for which the Successful call property is false. For requests, by default, Successful request == (resultCode < 400) (unless you write custom code to filter or generate your own TrackRequest calls).
Your app's performance has a typical pattern of behavior. Some requests or dependency calls are more prone to failure than others; and the overall failure rate may go up as load increases. Smart Detection uses machine learning to find these anomalies.
As data comes into Application Insights from your web app, Smart Detection compares the current behavior with the patterns seen over the past few days. If the detector discovers an abnormal rise in failure rate comparison with previous performance, the detector triggers a more in-depth analysis.
When an analysis is triggered, the service performs a cluster analysis on the failed request, to try to identify a pattern of values that characterize the failures.
In the example shown before, the analysis discovered that most failures are about a specific result code, request name, Server URL host, and role instance.
When you instrument your service with these calls, the analyzer looks for an exception and a dependency failure that are associated with requests in the identified cluster. It also looks for an example of any trace logs, associated with those requests. The alert you receive includes this additional information that can provide context to the detection and hint on the root cause for the detected problem.
Alert logic details
Failure Anomalies detection relies on a proprietary machine learning algorithm, so the reasons for an alert firing or not firing aren't always deterministic. With that said, the primary factors that the algorithm uses are:
- Analysis of the failure percentage of requests/dependencies in a rolling time window of 20 minutes.
- A comparison of the failure percentage in the last 20 minutes, to the rate in the last 40 minutes and the past seven days. The algorithm is looking for significant deviations that exceed X-times of the standard deviation.
- The algorithm is using an adaptive limit for the minimum failure percentage, which varies based on the app's volume of requests/dependencies.
- The algorithm includes logic that can automatically resolve the fired alert, if the issue is no longer detected for 8-24 hours. Note: in the current design. a notification or action isn't sent when a Smart Detection alert is resolved. You can check if a Smart Detection alert was resolved in the Azure portal.
Managing Failure Anomalies alert rules
Alert rule creation
A Failure Anomalies alert rule is created automatically when your Application Insights resource is created. The rule is automatically configured to analyze the telemetry on that resource. You can create the rule again using Azure REST API or using a Resource Manager template. Creating the rule can be useful if the automatic creation of the rule failed for some reason, or if you deleted the rule.
Alert rule configuration
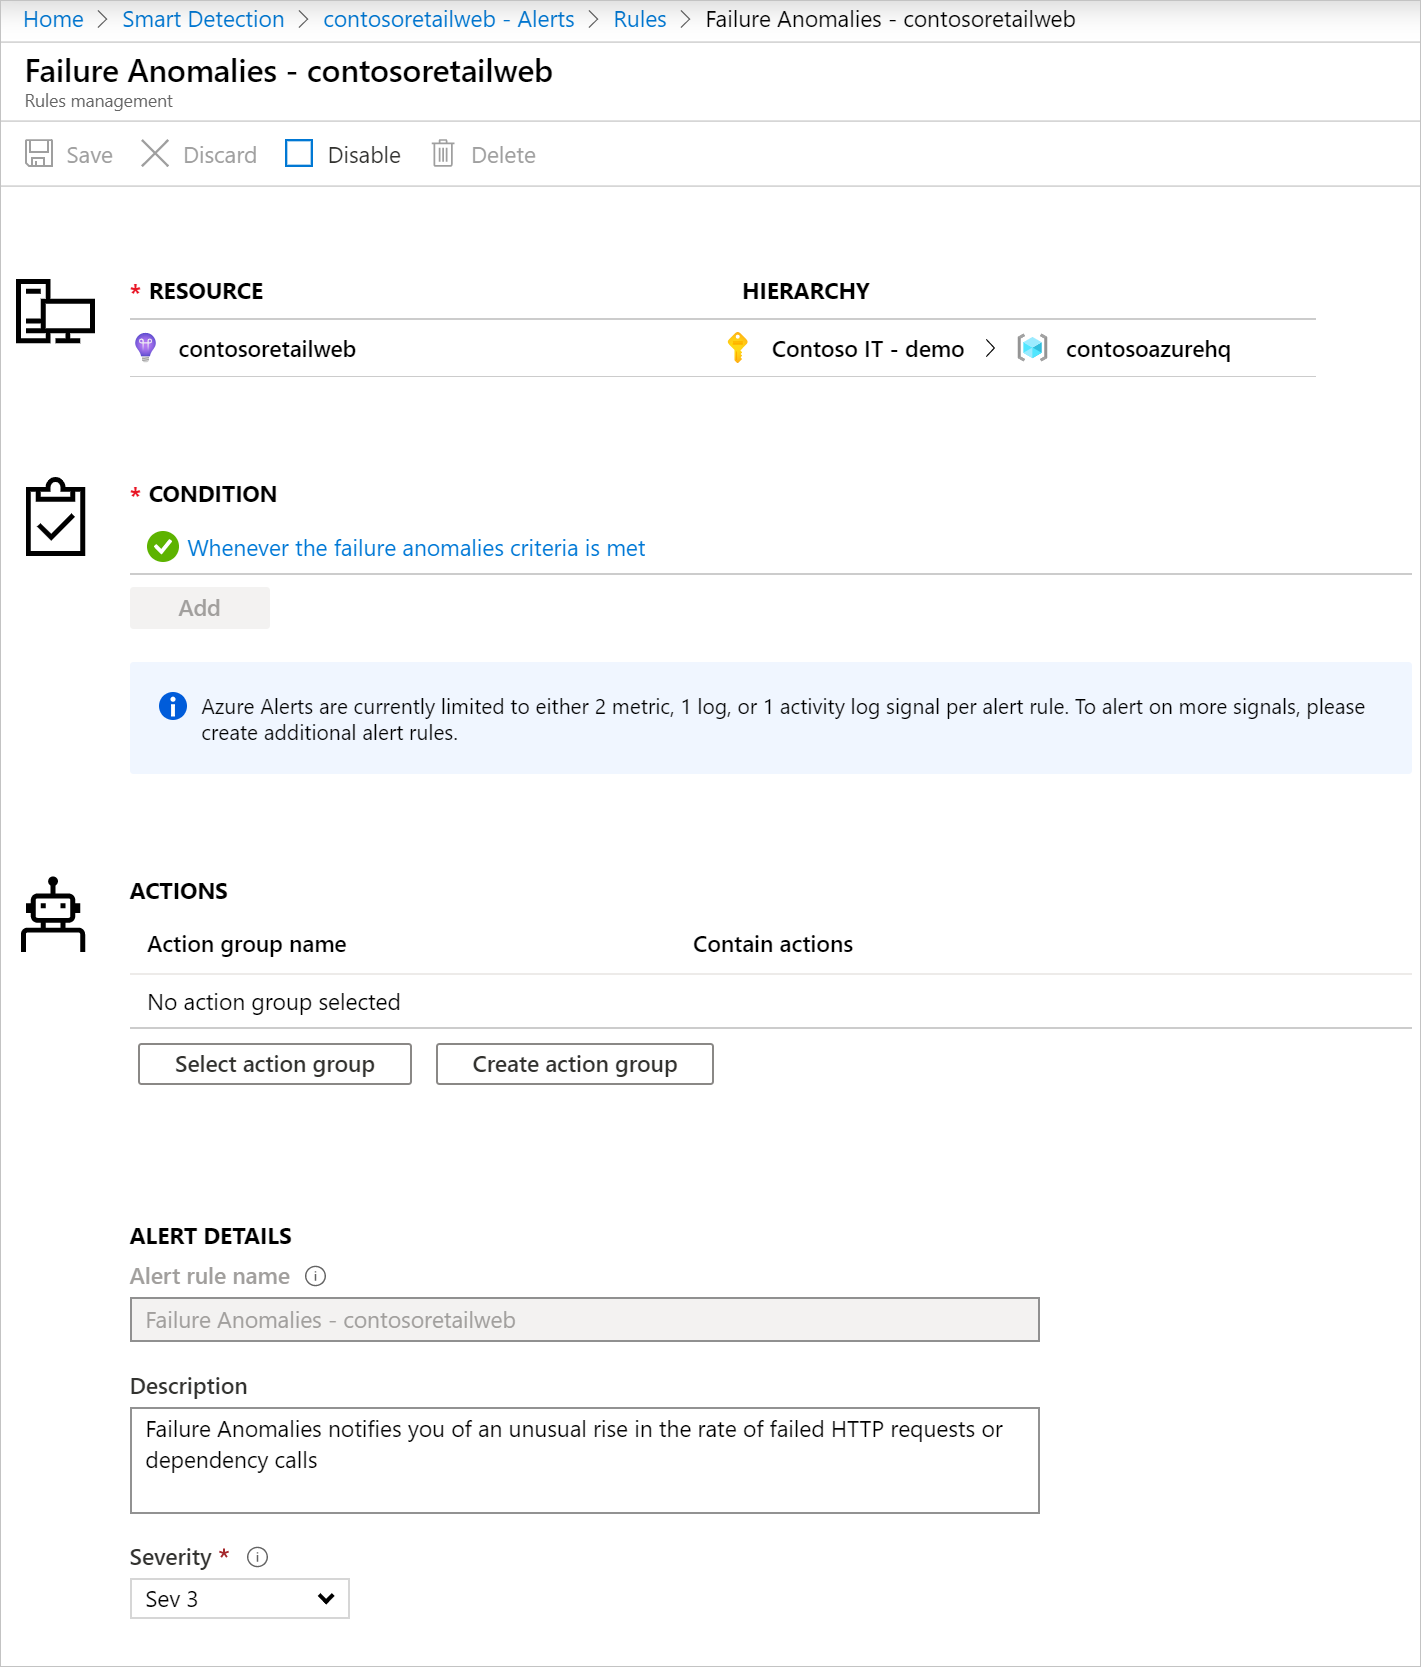
To configure a Failure Anomalies alert rule in the portal, open the Alerts page and select Alert Rules. Failure Anomalies alert rules are included along with any alerts that you set manually.
Click the alert rule to configure it.
You can disable Smart Detection alert rule from the portal or using an Azure Resource Manager template.
This alert rule is created with an associated action group named "Application Insights Smart Detection." By default, this action group contains Email Azure Resource Manager Role actions and sends notification to users who have Monitoring Contributor or Monitoring Reader subscription Azure Resource Manager roles in your subscription. You can remove, change or add the action groups that the rule triggers, as for any other Azure alert rule. Notifications sent from this alert rule follow the common alert schema.
Delete alerts
You can delete a Failure Anomalies alert rule.
You can do so manually on the Alert rules page or with the following Azure CLI command:
az resource delete --ids <Resource ID of Failure Anomalies alert rule>
Notice that if you delete an Application Insights resource, the associated Failure Anomalies alert rule doesn't get deleted automatically.
Example of Failure Anomalies alert webhook payload
{
"properties": {
"essentials": {
"severity": "Sev3",
"signalType": "Log",
"alertState": "New",
"monitorCondition": "Resolved",
"monitorService": "Smart Detector",
"targetResource": "/subscriptions/aaaa0a0a-bb1b-cc2c-dd3d-eeeeee4e4e4e/resourcegroups/test-group/providers/microsoft.insights/components/test-rule",
"targetResourceName": "test-rule",
"targetResourceGroup": "test-group",
"targetResourceType": "microsoft.insights/components",
"sourceCreatedId": "1a0a5b6436a9b2a13377f5c89a3477855276f8208982e0f167697a2b45fcbb3e",
"alertRule": "/subscriptions/aaaa0a0a-bb1b-cc2c-dd3d-eeeeee4e4e4e/resourcegroups/test-group/providers/microsoft.alertsmanagement/smartdetectoralertrules/failure anomalies - test-rule",
"startDateTime": "2019-10-30T17:52:32.5802978Z",
"lastModifiedDateTime": "2019-10-30T18:25:23.1072443Z",
"monitorConditionResolvedDateTime": "2019-10-30T18:25:26.4440603Z",
"lastModifiedUserName": "System",
"actionStatus": {
"isSuppressed": false
},
"description": "Failure Anomalies notifies you of an unusual rise in the rate of failed HTTP requests or dependency calls."
},
"context": {
"DetectionSummary": "An abnormal rise in failed request rate",
"FormattedOccurenceTime": "2019-10-30T17:50:00Z",
"DetectedFailureRate": "50.0% (200/400 requests)",
"NormalFailureRate": "0.0% (over the last 30 minutes)",
"FailureRateChart": [
[
"2019-10-30T05:20:00Z",
0
],
[
"2019-10-30T05:40:00Z",
100
],
[
"2019-10-30T06:00:00Z",
0
],
[
"2019-10-30T06:20:00Z",
0
],
[
"2019-10-30T06:40:00Z",
100
],
[
"2019-10-30T07:00:00Z",
0
],
[
"2019-10-30T07:20:00Z",
0
],
[
"2019-10-30T07:40:00Z",
100
],
[
"2019-10-30T08:00:00Z",
0
],
[
"2019-10-30T08:20:00Z",
0
],
[
"2019-10-30T08:40:00Z",
100
],
[
"2019-10-30T17:00:00Z",
0
],
[
"2019-10-30T17:20:00Z",
0
],
[
"2019-10-30T09:00:00Z",
0
],
[
"2019-10-30T09:20:00Z",
0
],
[
"2019-10-30T09:40:00Z",
100
],
[
"2019-10-30T10:00:00Z",
0
],
[
"2019-10-30T10:20:00Z",
0
],
[
"2019-10-30T10:40:00Z",
100
],
[
"2019-10-30T11:00:00Z",
0
],
[
"2019-10-30T11:20:00Z",
0
],
[
"2019-10-30T11:40:00Z",
100
],
[
"2019-10-30T12:00:00Z",
0
],
[
"2019-10-30T12:20:00Z",
0
],
[
"2019-10-30T12:40:00Z",
100
],
[
"2019-10-30T13:00:00Z",
0
],
[
"2019-10-30T13:20:00Z",
0
],
[
"2019-10-30T13:40:00Z",
100
],
[
"2019-10-30T14:00:00Z",
0
],
[
"2019-10-30T14:20:00Z",
0
],
[
"2019-10-30T14:40:00Z",
100
],
[
"2019-10-30T15:00:00Z",
0
],
[
"2019-10-30T15:20:00Z",
0
],
[
"2019-10-30T15:40:00Z",
100
],
[
"2019-10-30T16:00:00Z",
0
],
[
"2019-10-30T16:20:00Z",
0
],
[
"2019-10-30T16:40:00Z",
100
],
[
"2019-10-30T17:30:00Z",
50
]
],
"ArmSystemEventsRequest": "/subscriptions/aaaa0a0a-bb1b-cc2c-dd3d-eeeeee4e4e4e/resourceGroups/test-group/providers/microsoft.insights/components/test-rule/query?query=%0d%0a++++++++++++++++systemEvents%0d%0a++++++++++++++++%7c+where+timestamp+%3e%3d+datetime(%272019-10-30T17%3a20%3a00.0000000Z%27)+%0d%0a++++++++++++++++%7c+where+itemType+%3d%3d+%27systemEvent%27+and+name+%3d%3d+%27ProactiveDetectionInsight%27+%0d%0a++++++++++++++++%7c+where+dimensions.InsightType+in+(%275%27%2c+%277%27)+%0d%0a++++++++++++++++%7c+where+dimensions.InsightDocumentId+%3d%3d+%27718fb0c3-425b-4185-be33-4311dfb4deeb%27+%0d%0a++++++++++++++++%7c+project+dimensions.InsightOneClassTable%2c+%0d%0a++++++++++++++++++++++++++dimensions.InsightExceptionCorrelationTable%2c+%0d%0a++++++++++++++++++++++++++dimensions.InsightDependencyCorrelationTable%2c+%0d%0a++++++++++++++++++++++++++dimensions.InsightRequestCorrelationTable%2c+%0d%0a++++++++++++++++++++++++++dimensions.InsightTraceCorrelationTable%0d%0a++++++++++++&api-version=2018-04-20",
"LinksTable": [
{
"Link": "<a href=\"https://portal.azure.cn/#blade/AppInsightsExtension/ProactiveDetectionFeedBlade/ComponentId/{\"SubscriptionId\":\"aaaa0a0a-bb1b-cc2c-dd3d-eeeeee4e4e4e\",\"ResourceGroup\":\"test-group\",\"Name\":\"test-rule\"}/SelectedItemGroup/bbbb1b1b-cc2c-dd3d-ee4e-ffffff5f5f5f/SelectedItemTime/2019-10-30T17:50:00Z/InsightType/5\" target=\"_blank\">View full details in Application Insights</a>"
}
],
"SmartDetectorId": "FailureAnomaliesDetector",
"SmartDetectorName": "Failure Anomalies",
"AnalysisTimestamp": "2019-10-30T17:52:32.5802978Z"
},
"egressConfig": {
"displayConfig": [
{
"rootJsonNode": null,
"sectionName": null,
"displayControls": [
{
"property": "DetectionSummary",
"displayName": "What was detected?",
"type": "Text",
"isOptional": false,
"isPropertySerialized": false
},
{
"property": "FormattedOccurenceTime",
"displayName": "When did this occur?",
"type": "Text",
"isOptional": false,
"isPropertySerialized": false
},
{
"property": "DetectedFailureRate",
"displayName": "Detected failure rate",
"type": "Text",
"isOptional": false,
"isPropertySerialized": false
},
{
"property": "NormalFailureRate",
"displayName": "Normal failure rate",
"type": "Text",
"isOptional": false,
"isPropertySerialized": false
},
{
"chartType": "Line",
"xAxisType": "Date",
"yAxisType": "Percentage",
"xAxisName": "",
"yAxisName": "",
"property": "FailureRateChart",
"displayName": "Failure rate over last 12 hours",
"type": "Chart",
"isOptional": false,
"isPropertySerialized": false
},
{
"defaultLoad": true,
"displayConfig": [
{
"rootJsonNode": null,
"sectionName": null,
"displayControls": [
{
"showHeader": false,
"columns": [
{
"property": "Name",
"displayName": "Name"
},
{
"property": "Value",
"displayName": "Value"
}
],
"property": "tables[0].rows[0][0]",
"displayName": "All of the failed requests had these characteristics:",
"type": "Table",
"isOptional": false,
"isPropertySerialized": true
}
]
}
],
"property": "ArmSystemEventsRequest",
"displayName": "",
"type": "ARMRequest",
"isOptional": false,
"isPropertySerialized": false
},
{
"showHeader": false,
"columns": [
{
"property": "Link",
"displayName": "Link"
}
],
"property": "LinksTable",
"displayName": "Links",
"type": "Table",
"isOptional": false,
"isPropertySerialized": false
}
]
}
]
}
},
"id": "/subscriptions/aaaa0a0a-bb1b-cc2c-dd3d-eeeeee4e4e4e/resourcegroups/test-group/providers/microsoft.insights/components/test-rule/providers/Microsoft.AlertsManagement/alerts/cccc2c2c-dd3d-ee4e-ff5f-aaaaaa6a6a6a",
"type": "Microsoft.AlertsManagement/alerts",
"name": "Failure Anomalies - test-rule"
}
Triage and diagnose an alert
An alert indicates that an abnormal rise in the failed request rate was detected. It's likely that there's some problem with your app or its environment.
To investigate further, click on 'View full details in Application Insights.' The links in this page take you straight to a search page filtered to the relevant requests, exception, dependency, or traces.
To investigate further, click on 'View full details in Application Insights' the links in this page take you straight to a search page filtered to the relevant requests, exception, dependency, or traces.
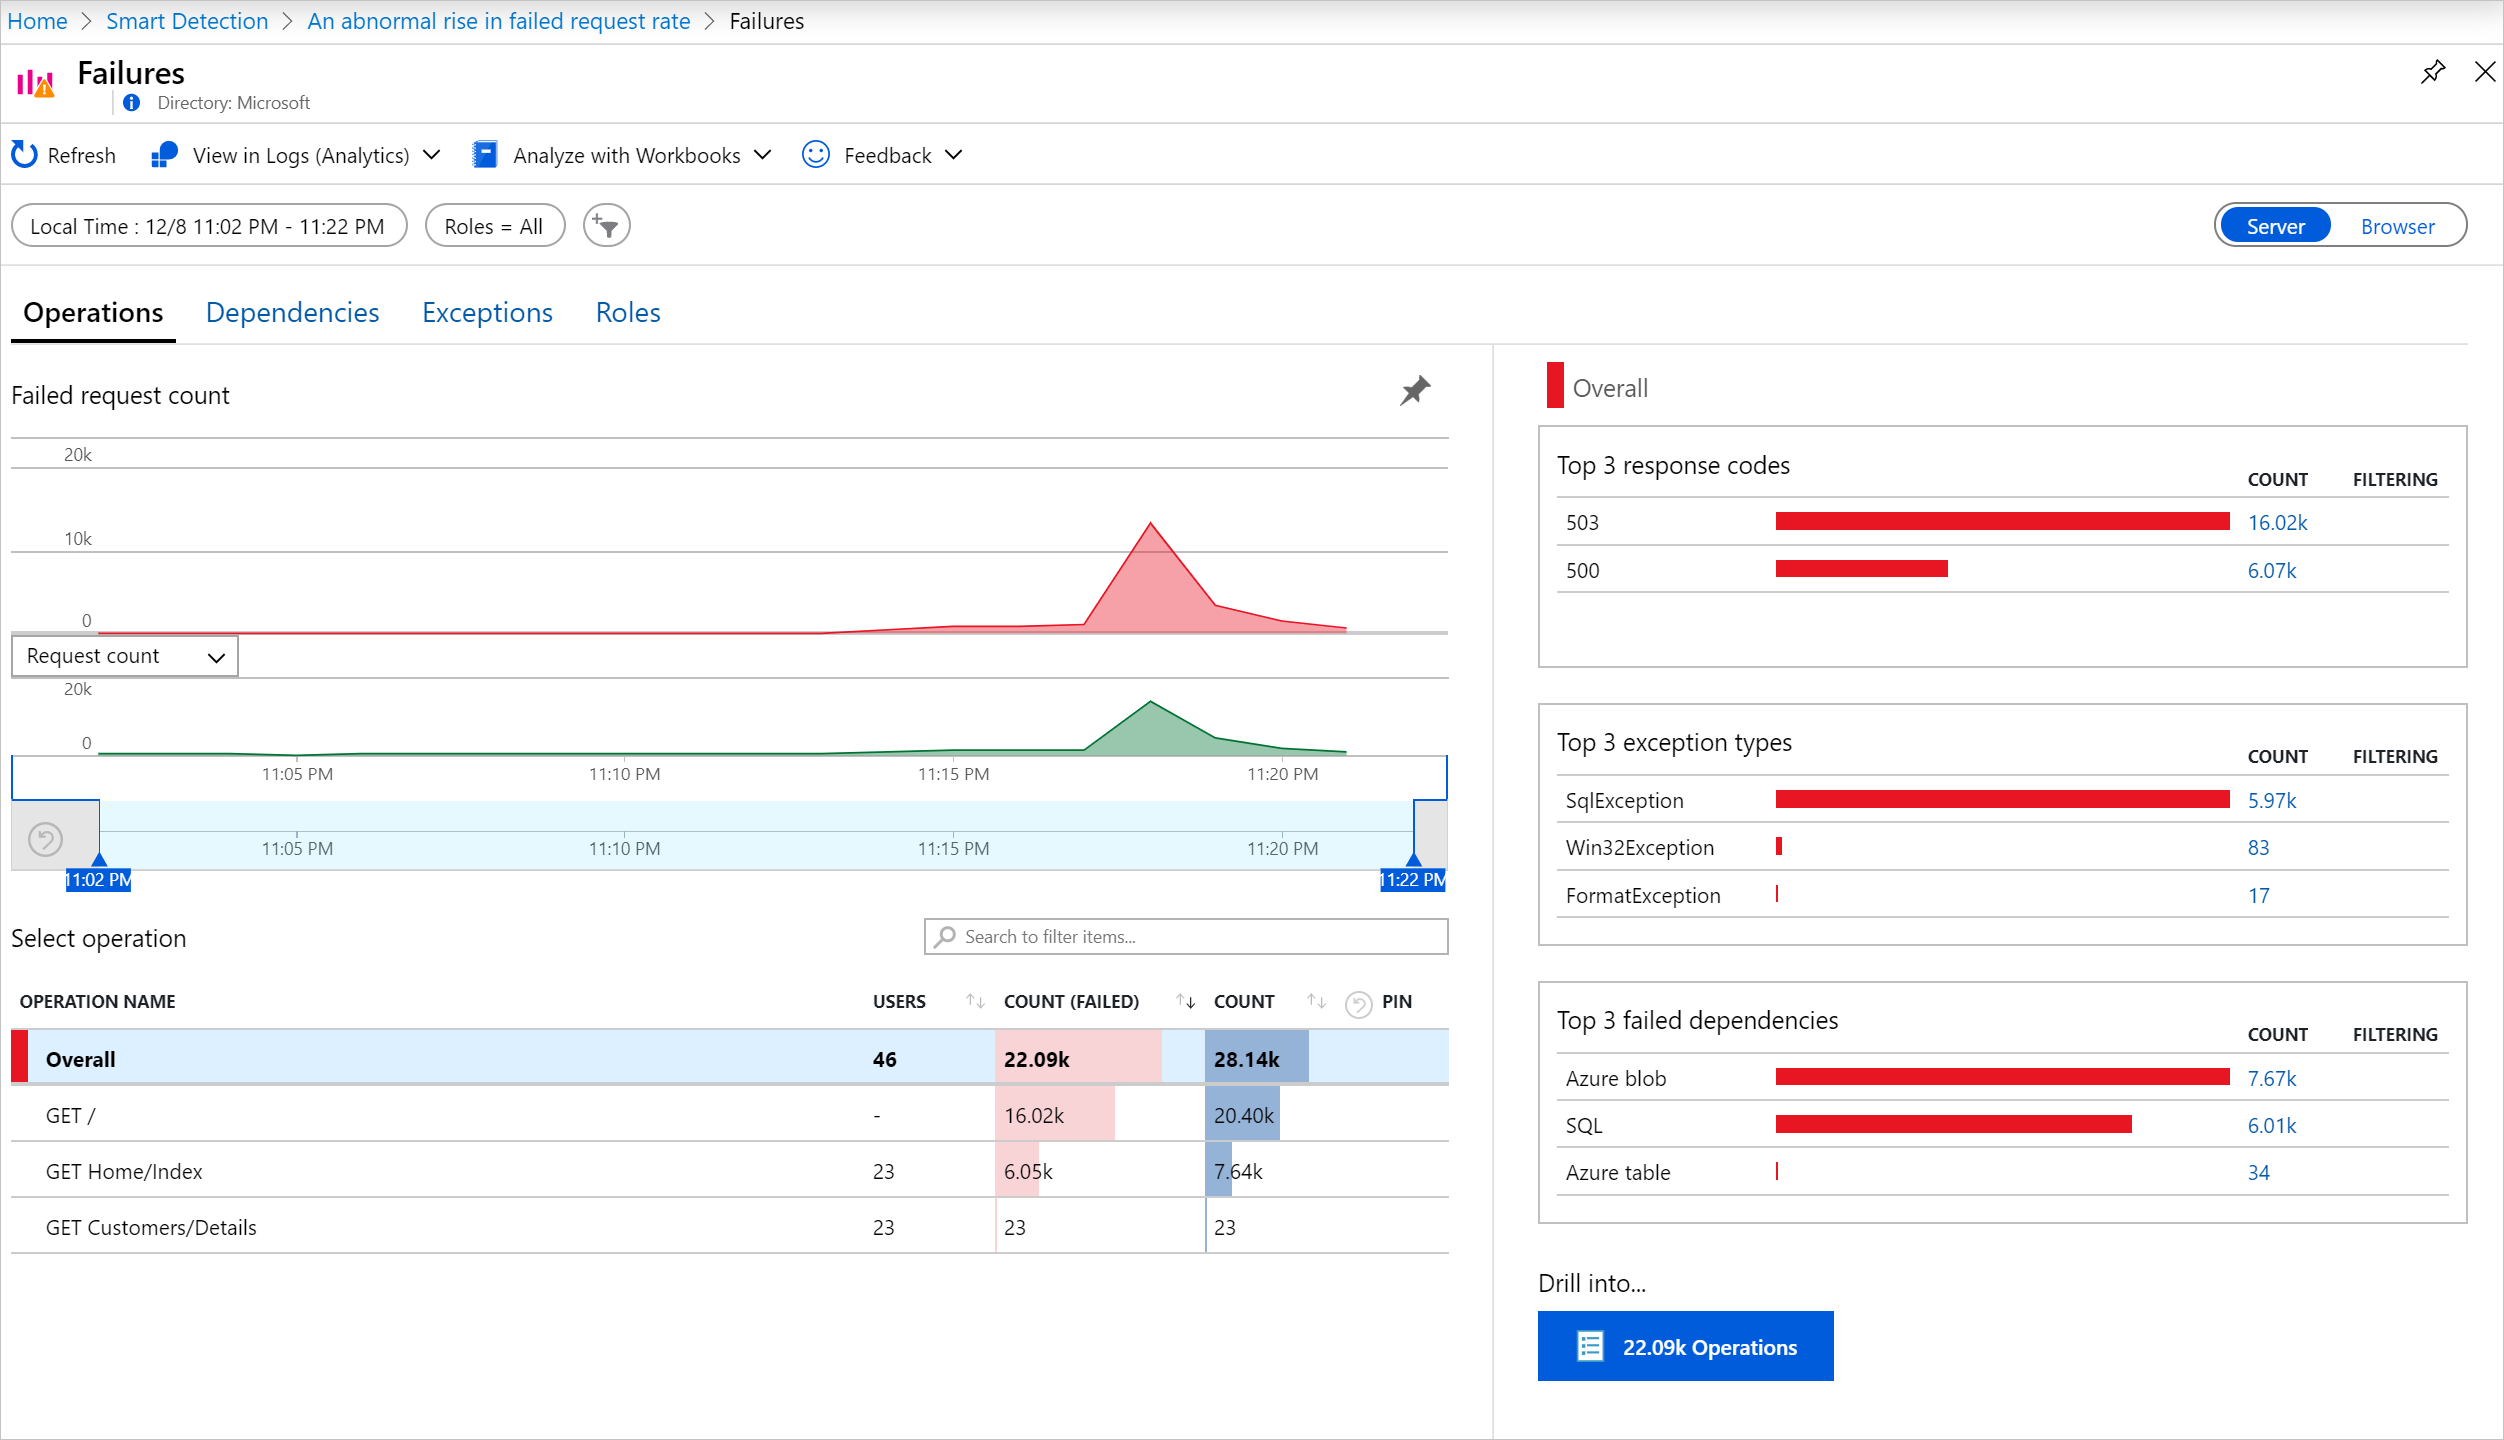
You can also open the Azure portal, navigate to the Application Insights resource for your app, and open the Failures page.
Clicking on 'Diagnose failures' can help you get more details and resolve the issue.
From the percentage of requests and number of users affected, you can decide how urgent the issue is. In the example shown before, the failure rate of 78.5% compares with a normal rate of 2.2%, indicates that something bad is going on. On the other hand, only 46 users were affected. This information can help you to assess how serious the problem is.
In many cases, you can diagnose the problem quickly from the request name, exception, dependency failure, and trace data provided.
In this example, there was an exception from SQL Database due to request limit being reached.
Review recent alerts
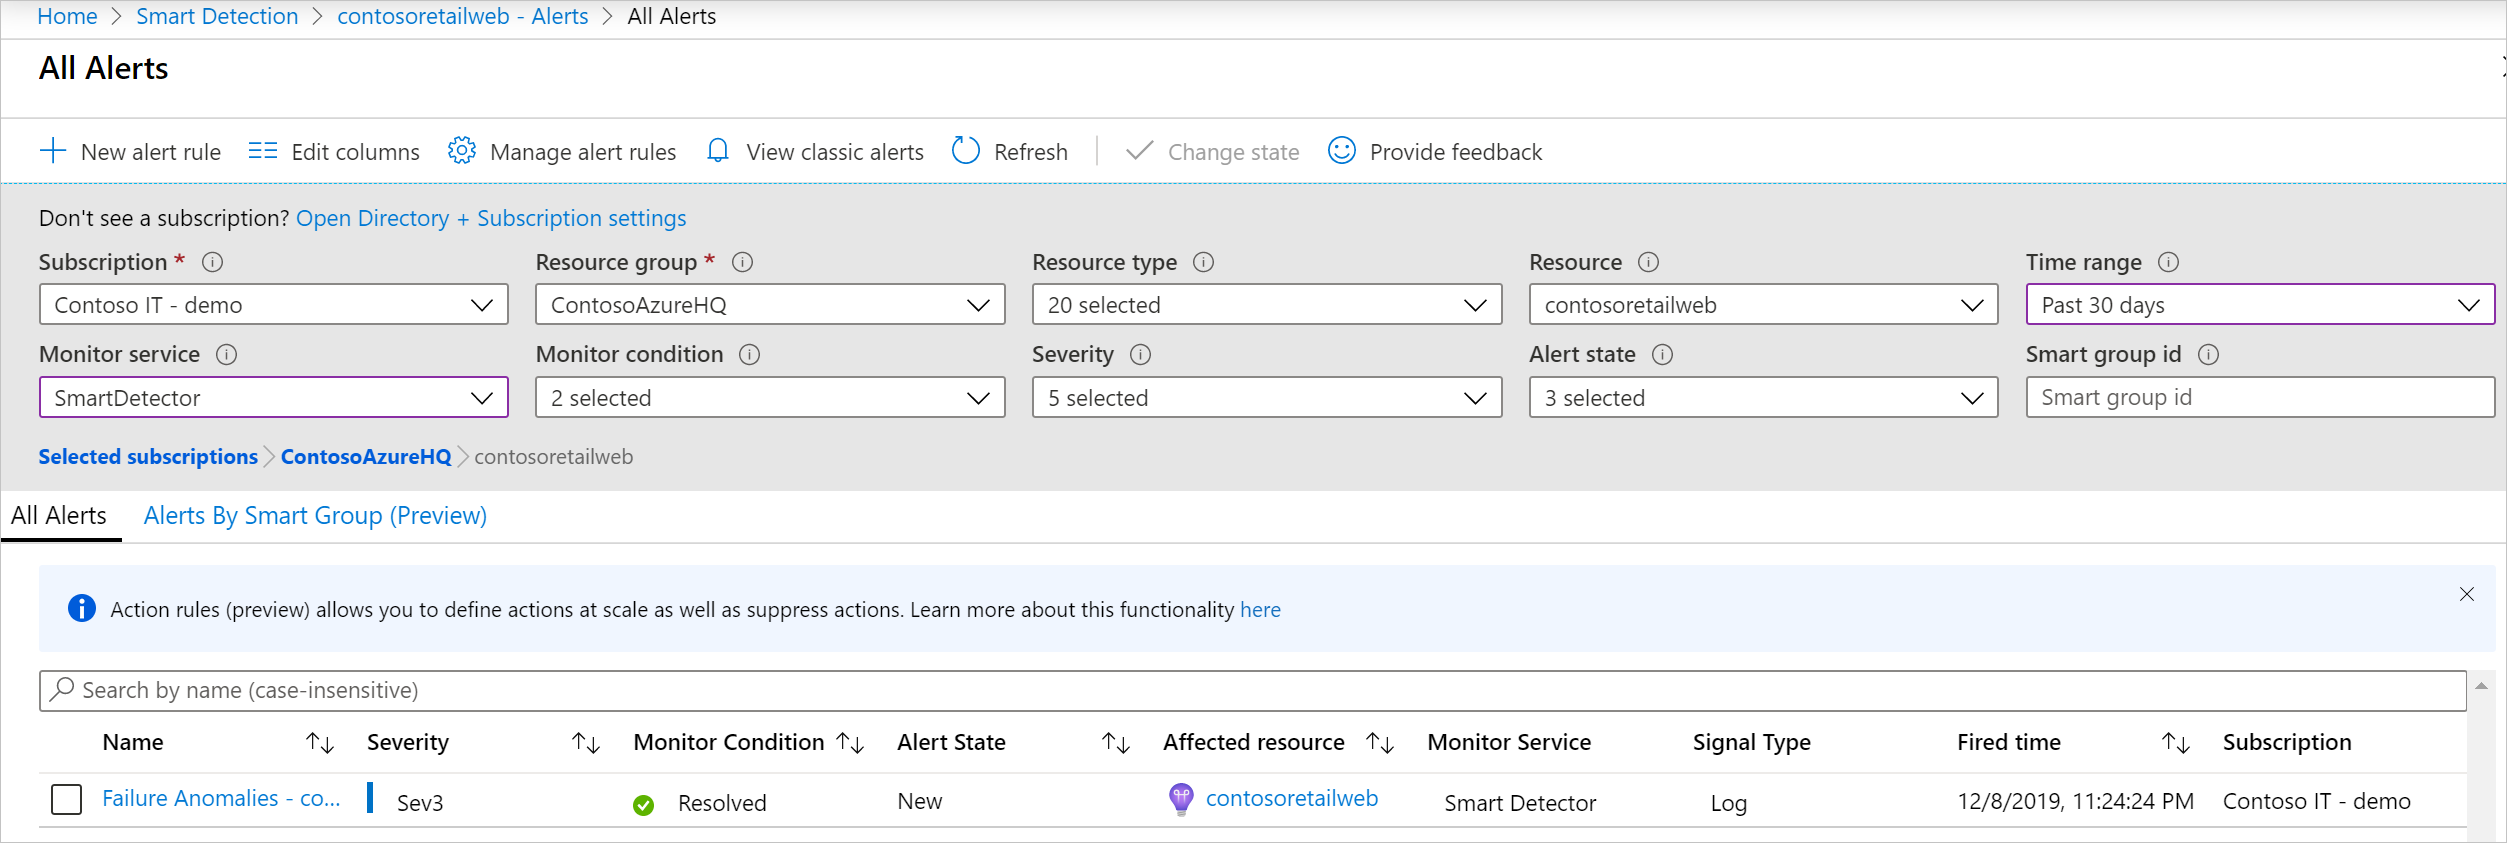
Click Alerts in the Application Insights resource page to get to the most recent fired alerts:
If you receive a Smart Detection alert
Why I received this alert?
- We detected an abnormal rise in failed requests rate compared to the normal baseline of the preceding period. After analysis of the failures and associated application data, we think that there's a problem that you should look into.
Does the notification mean I definitely have a problem?
- We try to alert on app disruption or degradation, but only you can fully understand the semantics and the impact on the app or users.
So, you're looking at my application data?
- No. The service is entirely automatic. Only you get the notifications. Your data is private.
Do I have to subscribe to this alert?
- No. Every application that sends request data has the Smart Detection alert rule.
Can I unsubscribe or get the notifications sent to my colleagues instead?
- Yes, In Alert rules, click the Smart Detection rule to configure it. You can disable the alert, or change recipients for the alert.
I lost the email. Where can I find the notifications in the portal?
- You can find Failure Anomalies alerts in the Azure portal, in your Application Insights alerts page.
Some of the alerts are about known issues and I don't want to receive them.
- You can use alert action rules suppression feature.
Next steps
These diagnostic tools help you inspect the data from your app:
Smart detections are automatic. But maybe you'd like to set up some more alerts?


