Profile live Azure Cloud Services with Application Insights
You can also deploy Application Insights Profiler on these services:
Application Insights Profiler is installed with the Azure Diagnostics extension. You just need to configure Azure Diagnostics to install Profiler and send profiles to your Application Insights resource.
Enable Profiler for Azure Cloud Services
Check to make sure that you're using .NET Framework 4.6.1 or newer. If you are using OS family 4, you'll need to install .NET Framework 4.6.1 or newer with a startup task. OS Family 5 includes a compatible version of .NET Framework by default.
Add Application Insights SDK to Azure Cloud Services.
The bug in the profiler that ships in the WAD for Cloud Services has been fixed. The latest version of WAD (1.12.2.0) for Cloud Services works with all recent versions of the App Insights SDK. Cloud Service hosts will upgrade WAD automatically, but it isn't immediate. To force an upgrade, you can redeploy your service or reboot the node.
Track requests with Application Insights:
For ASP.NET web roles, Application Insights can track the requests automatically.
For worker roles, add code to track requests.
Configure the Azure Diagnostics extension to enable Profiler:
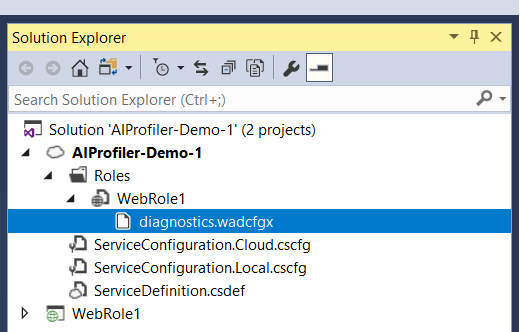
a. Locate the Azure Diagnostics diagnostics.wadcfgx file for your application role, as shown here:
If you can't find the file, see Set up diagnostics for Azure Cloud Services and Virtual Machines.
b. Add the following
SinksConfigsection as a child element ofWadCfg:<WadCfg> <DiagnosticMonitorConfiguration>...</DiagnosticMonitorConfiguration> <SinksConfig> <Sink name="MyApplicationInsightsProfiler"> <!-- Replace with your own Application Insights instrumentation key. --> <ApplicationInsightsProfiler>00000000-0000-0000-0000-000000000000</ApplicationInsightsProfiler> </Sink> </SinksConfig> </WadCfg>Note
If the diagnostics.wadcfgx file also contains another sink of type ApplicationInsights, all three of the following instrumentation keys must match:
- The key that's used by your application.
- The key that's used by the ApplicationInsights sink.
- The key that's used by the ApplicationInsightsProfiler sink.
You can find the actual instrumentation key value that's used by the
ApplicationInsightssink in the ServiceConfiguration.*.cscfg files. After the Visual Studio 15.5 Azure SDK release, only the instrumentation keys that are used by the application and the ApplicationInsightsProfiler sink need to match each other.Deploy your service with the new Diagnostics configuration, and Application Insights Profiler is configured to run on your service.
Note
On March 31, 2025, support for instrumentation key ingestion will end. Instrumentation key ingestion will continue to work, but we'll no longer provide updates or support for the feature. Transition to connection strings to take advantage of new capabilities.
Next steps
- Generate traffic to your application (for example, launch an availability test). Then, wait 10 to 15 minutes for traces to start to be sent to the Application Insights instance.
- See Profiler traces in the Azure portal.
- To troubleshoot Profiler issues, see Profiler troubleshooting.