Note
Access to this page requires authorization. You can try signing in or changing directories.
Access to this page requires authorization. You can try changing directories.
Note
Container Insights logs are only throttled when Container Network Logs are being collected. If you have not enabled the collection of Container Network Logs, throttling is not enabled on your cluster.
Azure Monitor - Container Insights allow customers to collect logs generated in their Azure Kubernetes Service (AKS) cluster. Depending on workload and logging configuration, the volume of logs generated can be substantial, leading to throttling and log loss. This article discusses the default values after which logs are throttled in Container Insights. We discuss how customers can modify these values. The final section covers how you can monitor for potential throttling issues with our Quality-of-Service (QoS) Grafana dashboard.
Default Throttling values
Throttling is enabled by default with the following values:
| ConfigMap setting | Default value | Description |
|---|---|---|
| throttle_enabled | true | By default is true and adjust this value to control whether to enable or disable network flow log messages. |
| throttle_rate | 5000 | By default is 5000 and range from 1 to 25,000 and adjust this value to control the number of log records during a time window. |
| throttle_window | 300 | By default is 300 and adjust this value to control the number of intervals to calculate average over. |
| throttle_interval | 1s | By default is 1s and adjust this value to control time interval, expressed in "sleep" format. Examples: 3s, 1.5m, 0.5h etc. |
| throttle_print | false | By default is false and adjust this value to control whether to print status messages with current rate and the limits to information logs. |
Modifying throttling values
To modify the default values, download ConfigMap and modify below settings to downloaded ConfigMap:
throttle_enabled = true # By default is true and adjust this value to control whether to enable or disable network flow log messages.
throttle_rate = 5000 # By default is 5000 and range from 1 to 25,000 and adjust this value to control the amount of messages for the time.
throttle_window = 300 # By default is 300 and adjust this value to control the amount of intervals to calculate average over.
throttle_interval = "1s" # By default is 1s and adjust this value to control time interval, expressed in "sleep" format. Examples: 3s, 1.5m, 0.5h etc.
throttle_print = false # By default is false and adjust this value to control whether to print status messages with current rate and the limits to information logs.
Once you apply the configmap via kubectl apply command, the pods shall get restarted within a few minutes.
kubectl apply -f agent_settings.networkflow_logs_config.yaml
Monitor QoS metrics with Prometheus and Grafana
The Logs add-on that collects Container Network logs publishes QoS metrics that can be used to monitor for throttling and log loss. In this section, we cover how can customers can use Azure Monitor managed service for Prometheus to collect these metrics and then visualize them with Grafana.
Pre-requisites
- Azure Monitor managed service for Prometheus: The QoS metrics generated are sent to the managed Prometheus service. Enable by following the these instructions
- A Grafana instance to import the dashboard. This Grafana instance can be an instance of Azure managed Grafana or any other Grafana instance linked with the Prometheus service mentioned previously.
Configuration steps
- Download the ama-metrics-prometheus-config-node ConfigMap
curl -LO https://aka.ms/ama-metrics-prometheus-config-node
- Check if you already have an existing ama-metrics-prometheus-config-node ConfigMap via
kubectl get cm -n kube-system | grep ama-metrics-prometheus-config-node
If there's an existing ConfigMap, then you can add the ama-logs-daemonset scrape job to the existing ConfigMap else you can apply this ConfigMap through
kubectl apply -f ama-metrics-prometheus-config-node.yaml
Import Grafana dashboard JSON file to the Azure Managed Grafana Instance.
Configure the enable_internal_metrics = true in ConfigMap https://github.com/microsoft/Docker-Provider/blob/ci_prod/kubernetes/container-azm-ms-agentconfig.yaml#L220
Apply the configmap with:
kubectl apply -f container-azm-ms-agentconfig.yaml
Final dashboard
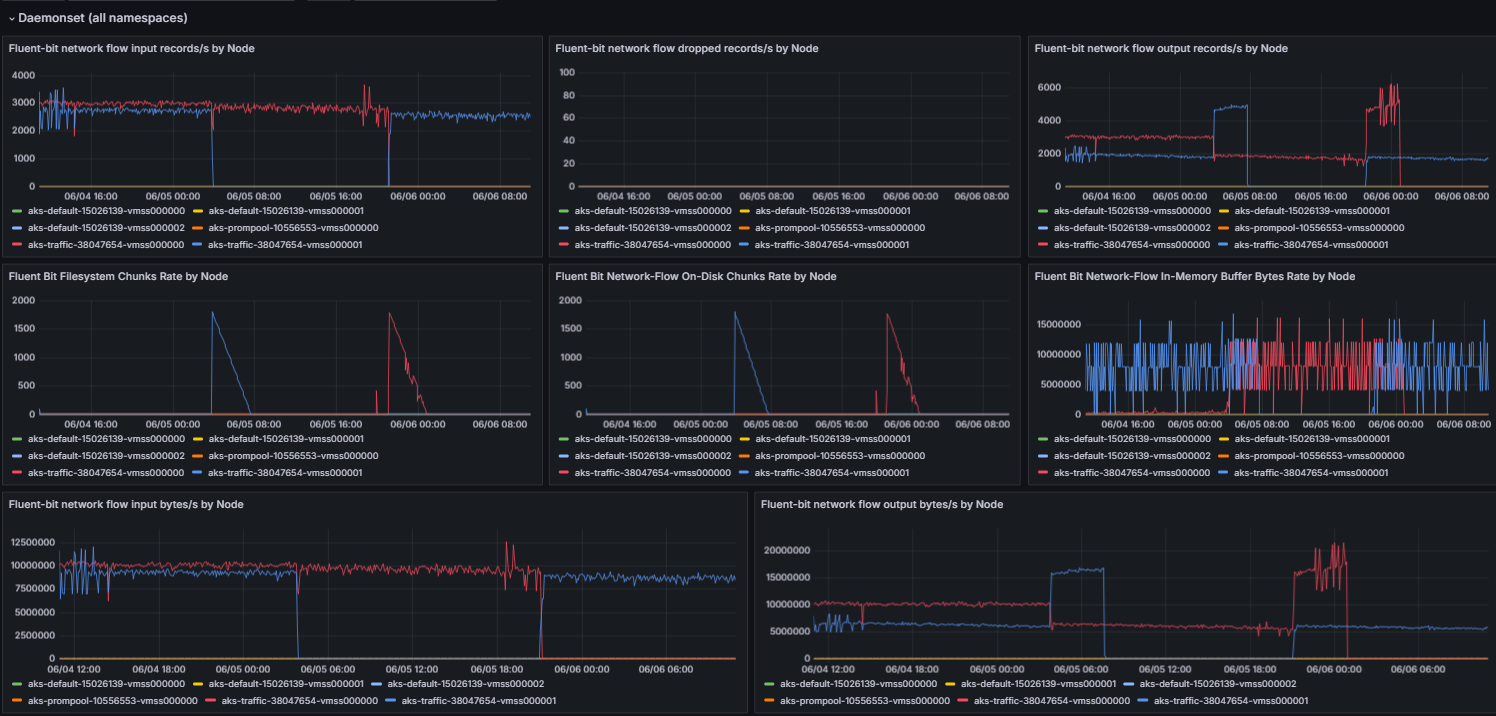
The final QoS dashboard with data flowing is shown in the following image:
