Microsoft Entra authorization proxy
The Microsoft Entra authorization proxy is a reverse proxy, which can be used to authenticate requests using Microsoft Entra ID. This proxy can be used to authenticate requests to any service that supports Microsoft Entra authentication. Use this proxy to authenticate requests to Azure Monitor managed service for Prometheus.
Prerequisites
- An Azure Monitor workspace. If you don't have a workspace, create one using this article.
- Prometheus installed on your cluster.
Note
The remote write example in this article uses Prometheus remote write to write data to Azure Monitor. Onboarding your AKS cluster to Prometheus automatically installs Prometheus on your cluster and sends data to your workspace.
Deployment
The proxy can be deployed with custom templates using release image or as a helm chart. Both deployments contain the same customizable parameters. These parameters are described in the Parameters table.
For for more information, see Microsoft Entra authentication proxy project.
The following examples show how to deploy the proxy for remote write and for querying data from Azure Monitor.
Note
This example shows how to use the proxy to authenticate requests for remote write to an Azure Monitor managed service for Prometheus. Prometheus remote write has a dedicated side car for remote writing which is the recommended method for implementing remote write.
Before deploying the proxy, find your managed identity and assign it the Monitoring Metrics Publisher role for the Azure Monitor workspace's data collection rule.
Find the
clientIdfor the managed identity for your AKS cluster. The managed identity is used to authenticate to the Azure Monitor workspace. The managed identity is created when the AKS cluster is created.# Get the identity client_id az aks show -g <AKS-CLUSTER-RESOURCE-GROUP> -n <AKS-CLUSTER-NAME> --query "identityProfile"The output has the following format:
{
  "kubeletidentity": {
    "clientId": "abcd1234-1243-abcd-9876-1234abcd5678",
    "objectId": "12345678-abcd-abcd-abcd-1234567890ab",
    "resourceId": "/subscriptions/def0123-1243-abcd-9876-1234abcd5678/resourcegroups/MC_rg-proxytest-01_proxytest-01_chinanorth/providers/Microsoft.ManagedIdentity/userAssignedIdentities/proxytest-01-agentpool"
  }
Find your Azure Monitor workspace's data collection rule (DCR) ID.
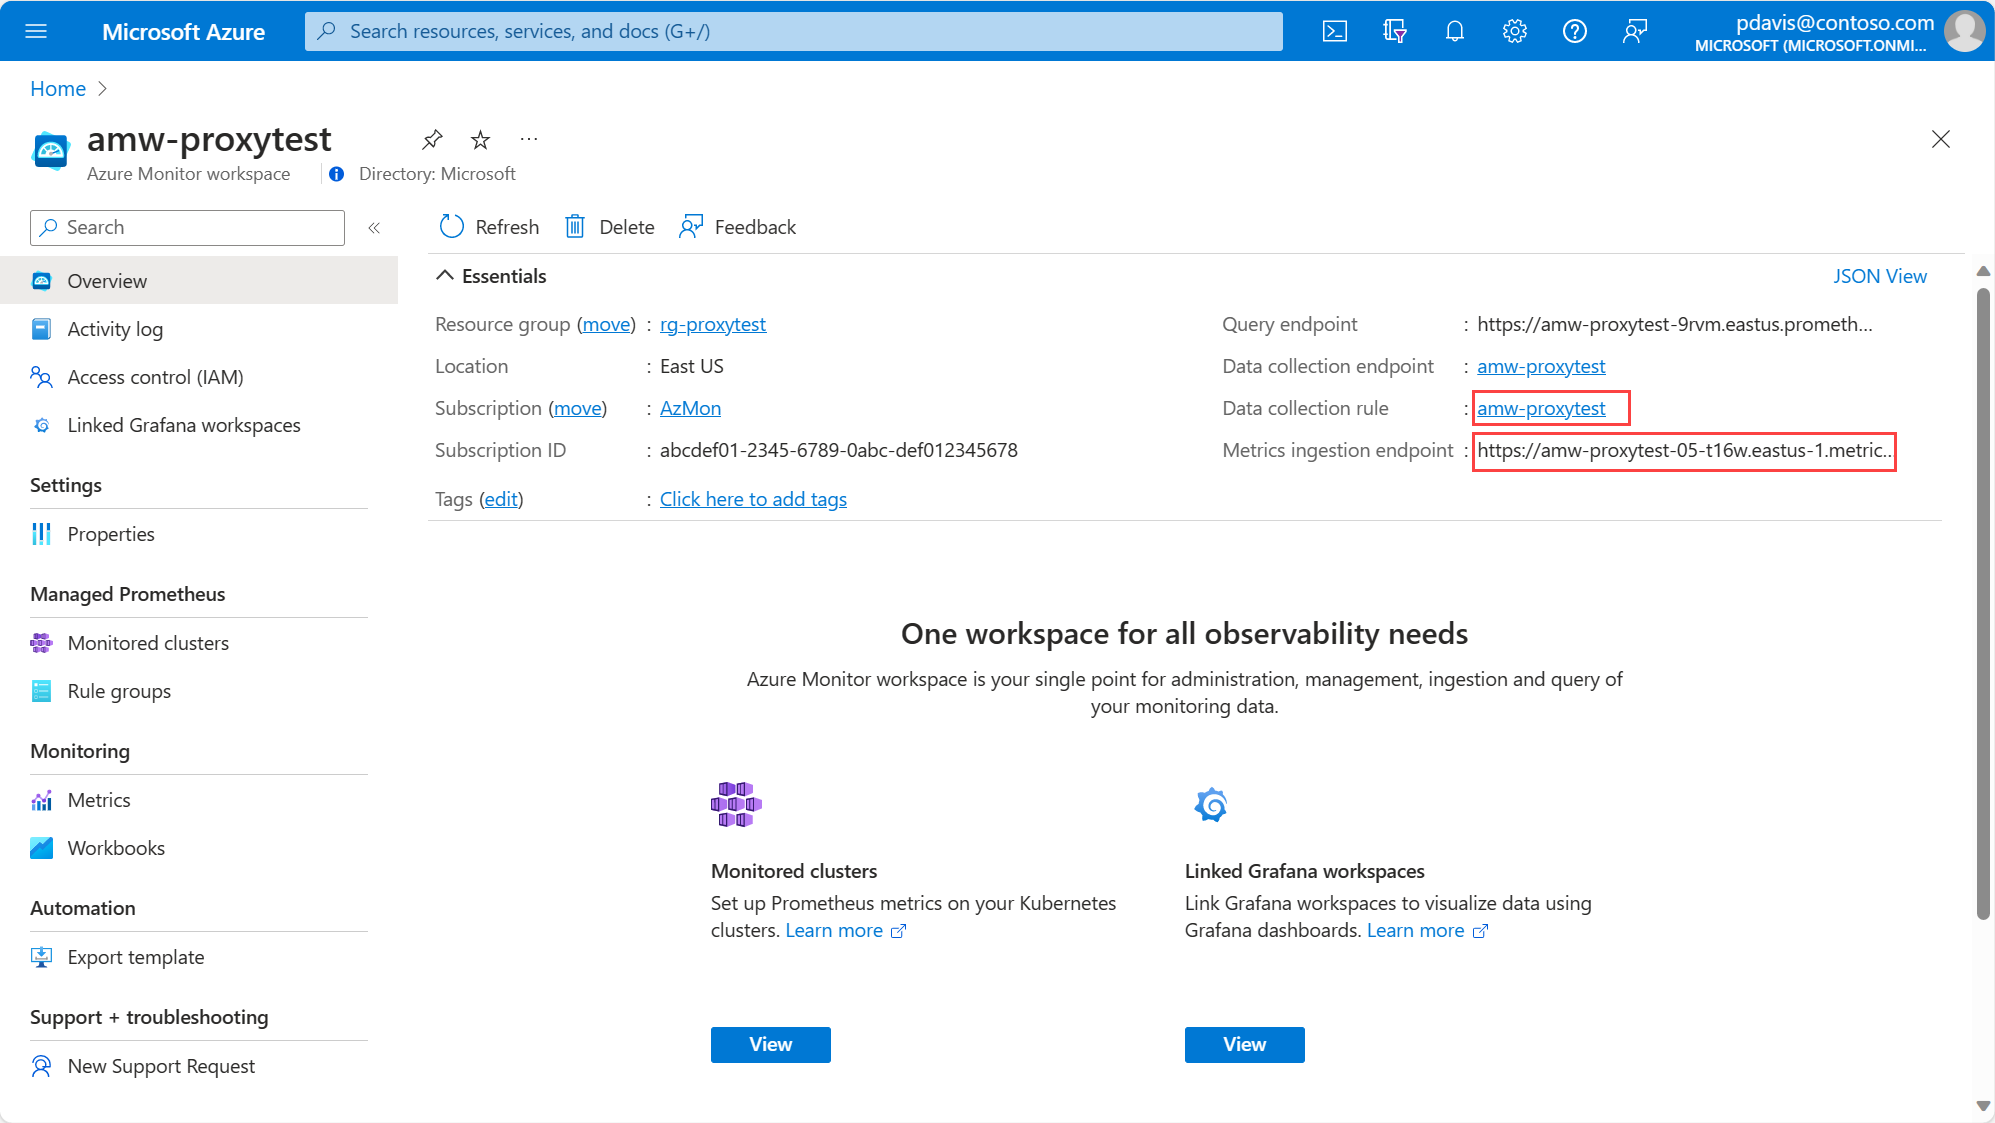
The rule name is same as the workspace name. The resource group name for your data collection rule follows the format:MA_<workspace-name>_<REGION>_managed, for exampleMA_amw-proxytest_chinanorth_managed. Use the following command to find the data collection rule ID:az monitor data-collection rule show --name <dcr-name> --resource-group <resource-group-name> --query "id"Alternatively you can find your DCR ID and Metrics ingestion endpoint using the Azure portal on the Azure Monitor workspace Overview page.
Select the Data collection rule on the workspace Overview tab, then select JSON view to see the Resource ID.
Assign the
Monitoring Metrics Publisherrole to the managed identity'sclientIdso that it can write to the Azure Monitor workspace data collection rule.az role assignment create / --assignee <clientid> / --role "Monitoring Metrics Publisher" / --scope <workspace-dcr-id>For example:
az role assignment create \
--assignee abcd1234-1243-abcd-9876-1234abcd5678  \
--role "Monitoring Metrics Publisher" \
--scope /subscriptions/ef0123-1243-abcd-9876-1234abcd5678/resourceGroups/MA_amw-proxytest_chinanorth_managed/providers/Microsoft.Insights/dataCollectionRules/amw-proxytest
Use the following YAML file to deploy the proxy for remote write. Modify the following parameters:
TARGET_HOST- The target host where you want to forward the request to. To send data to an Azure Monitor workspace, use the hostname part of theMetrics ingestion endpointfrom the workspaces Overview page. For example,http://amw-proxytest-abcd.chinanorth-1.metrics.ingest.monitor.azure.cnAAD_CLIENT_ID- TheclientIdof the managed identity used that was assigned theMonitoring Metrics Publisherrole.AUDIENCE- For ingesting metrics to Azure Monitor Workspace, setAUDIENCEtohttps://monitor.azure.cn/.default.- Remove
OTEL_GRPC_ENDPOINTandOTEL_SERVICE_NAMEif you aren't using OpenTelemetry.
For more information about the parameters, see the Parameters table.
proxy-ingestion.yaml
apiVersion: apps/v1
kind: Deployment
metadata:
    labels:
        app: azuremonitor-ingestion
    name: azuremonitor-ingestion
    namespace: observability
spec:
    replicas: 1
    selector:
        matchLabels:
            app: azuremonitor-ingestion
    template:
        metadata:
            labels:
                app: azuremonitor-ingestion
            name: azuremonitor-ingestion
        spec:
            containers:
            - name: aad-auth-proxy
              image: mcr.microsoft.com/azuremonitor/auth-proxy/prod/aad-auth-proxy/images/aad-auth-proxy:0.1.0-main-05-24-2023-b911fe1c
              imagePullPolicy: Always
              ports:
              - name: auth-port
                containerPort: 8081
              env:
              - name: AUDIENCE
                value: https://monitor.azure.cn/.default
              - name: TARGET_HOST
                value: http://<workspace-endpoint-hostname>
              - name: LISTENING_PORT
                value: "8081"
              - name: IDENTITY_TYPE
                value: userAssigned
              - name: AAD_CLIENT_ID
                value: <clientId>
              - name: AAD_TOKEN_REFRESH_INTERVAL_IN_PERCENTAGE
                value: "10"
              - name: OTEL_GRPC_ENDPOINT
                value: <YOUR-OTEL-GRPC-ENDPOINT> # "otel-collector.observability.svc.cluster.local:4317"
              - name: OTEL_SERVICE_NAME
                value: <YOUE-SERVICE-NAME>
              livenessProbe:
                httpGet:
                  path: /health
                  port: auth-port
                initialDelaySeconds: 5
                timeoutSeconds: 5
              readinessProbe:
                httpGet:
                  path: /ready
                  port: auth-port
                initialDelaySeconds: 5
                timeoutSeconds: 5
---
apiVersion: v1
kind: Service
metadata:
    name: azuremonitor-ingestion
    namespace: observability
spec:
    ports:
        - port: 80
          targetPort: 8081
    selector:
        app: azuremonitor-ingestion
Deploy the proxy using commands:
# create the namespace if it doesn't already exist
kubectl create namespace observability

kubectl apply -f proxy-ingestion.yaml -n observability
Alternatively you can deploy the proxy using helm as follows:
helm install aad-auth-proxy oci://mcr.microsoft.com/azuremonitor/auth-proxy/prod/aad-auth-proxy/helmchart/aad-auth-proxy \
--version 0.1.0-main-05-24-2023-b911fe1c \
-n observability \
--set targetHost=https://proxy-test-abc123.chinanorth-1.metrics.ingest.monitor.azure.cn \
--set identityType=userAssigned \
--set aadClientId= abcd1234-1243-abcd-9876-1234abcd5678 \
--set audience=https://monitor.azure.cn/.default
Configure remote write url.
The URL hostname is made up of the ingestion service name and namespace in the following format<ingestion service name>.<namespace>.svc.cluster.local. In this example, the host isazuremonitor-ingestion.observability.svc.cluster.local.
Configure the URL path using the path from theMetrics ingestion endpointfrom the Azure Monitor workspace Overview page. For example,dataCollectionRules/dcr-abc123d987e654f3210abc1def234567/streams/Microsoft-PrometheusMetrics/api/v1/write?api-version=2021-11-01-preview.prometheus: prometheusSpec: externalLabels: cluster: <cluster name to be used in the workspace> ## https://prometheus.io/docs/prometheus/latest/configuration/configuration/#remote_write ## remoteWrite: - url: "http://azuremonitor-ingestion.observability.svc.cluster.local/dataCollectionRules/dcr-abc123d987e654f3210abc1def234567/streams/Microsoft-PrometheusMetrics/api/v1/write?api-version=2021-11-01-preview"Apply the remote write configuration.
Note
For the latest proxy image version ,see the release notes
Check that the proxy is ingesting data
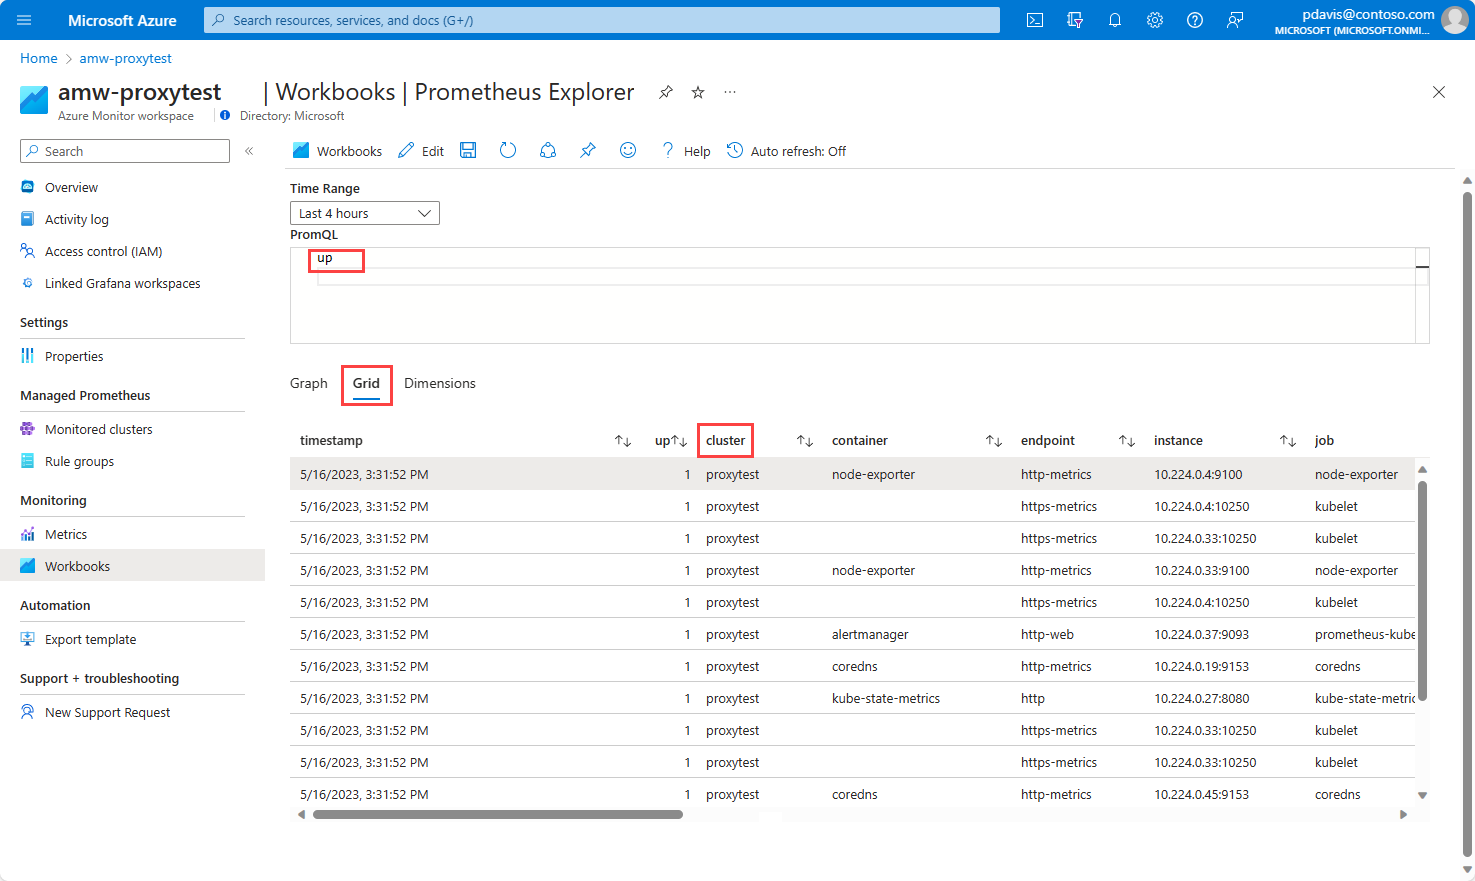
Check that the proxy is successfully ingesting metrics by checking the pod's logs, or by querying the Azure Monitor workspace.
Check the pod's logs by running the following commands:
# Get the azuremonitor-ingestion pod ID
 kubectl get pods -A | grep azuremonitor-ingestion
 #Using the returned pod ID, get the logs
 kubectl logs --namespace observability <pod ID> --tail=10
Successfully ingesting metrics produces a log with StatusCode=200 similar to the following:
time="2023-05-16T08:47:27Z" level=info msg="Successfully sent request, returning response back." ContentLength=0 Request="https://amw-proxytest-05-t16w.chinanorth-1.metrics.ingest.monitor.azure.cn/dataCollectionRules/dcr-688b6ed1f2244e098a88e32dde18b4f6/streams/Microsoft-PrometheusMetrics/api/v1/write?api-version=2021-11-01-preview" StatusCode=200
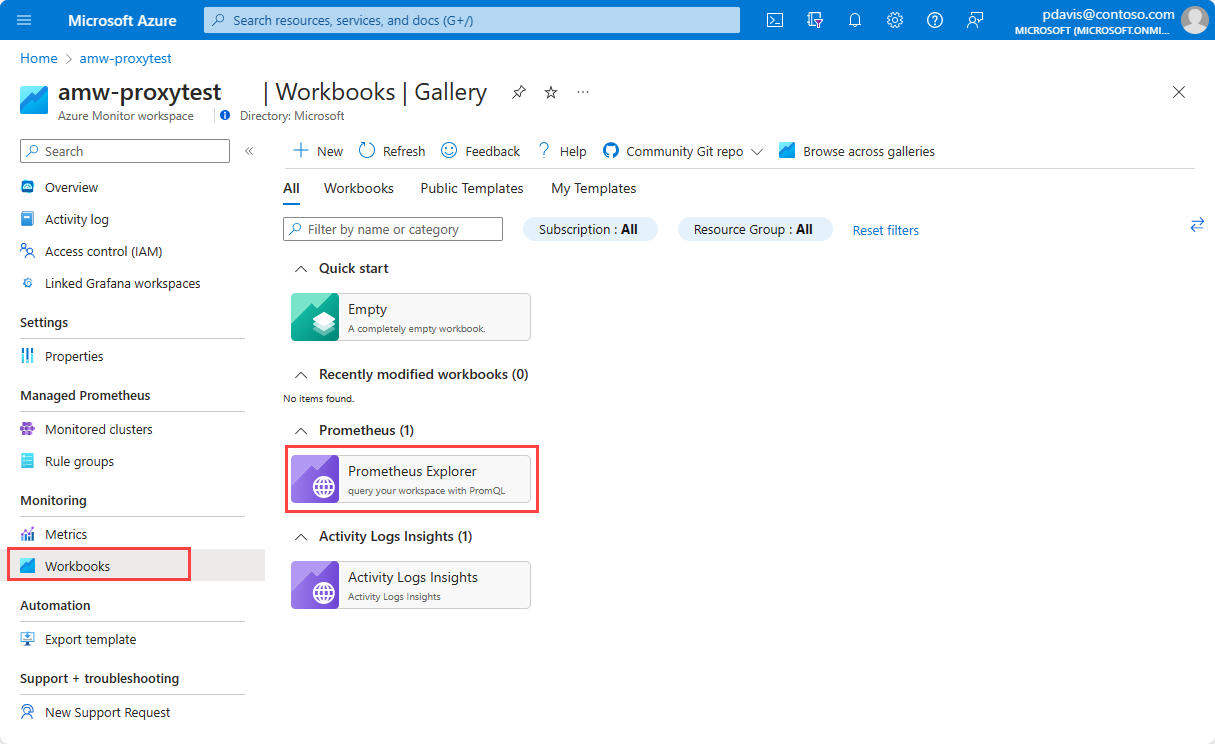
To query your Azure Monitor workspace, follow the steps below:
Parameters
| Image Parameter | Helm chart Parameter name | Description | Supported values | Mandatory |
|---|---|---|---|---|
TARGET_HOST |
targetHost |
Target host where you want to forward the request to. When sending data to an Azure Monitor workspace, use the Metrics ingestion endpoint from the workspaces Overview page. When reading data from an Azure Monitor workspace, use the Query endpoint from the workspaces Overview page |
Yes | |
IDENTITY_TYPE |
identityType |
Identity type that is used to authenticate requests. This proxy supports three types of identities. | systemassigned, userassigned, aadapplication |
Yes |
AAD_CLIENT_ID |
aadClientId |
Client ID of the identity used. This is used for userassigned and aadapplication identity types. Use az aks show -g <AKS-CLUSTER-RESOURCE-GROUP> -n <AKS-CLUSTER-NAME> --query "identityProfile" to retrieve the Client ID |
Yes for userassigned and aadapplication |
|
AAD_TENANT_ID |
aadTenantId |
Tenant ID of the identity used. Tenant ID is used for aadapplication identity types. |
Yes for aadapplication |
|
AAD_CLIENT_CERTIFICATE_PATH |
aadClientCertificatePath |
The path where proxy can find the certificate for aadapplication. This path should be accessible by proxy and should be a either a pfx or pem certificate containing private key. | For aadapplication identity types only |
|
AAD_TOKEN_REFRESH_INTERVAL_IN_PERCENTAGE |
aadTokenRefreshIntervalInMinutes |
Token is refreshed based on the percentage of time until token expiry. Default value is 10% time before expiry. | No | |
AUDIENCE |
audience |
Audience for the token | No | |
LISTENING_PORT |
listeningPort |
Proxy listening on this port | Yes | |
OTEL_SERVICE_NAME |
otelServiceName |
Service name for OTEL traces and metrics. Default value: aad_auth_proxy | No | |
OTEL_GRPC_ENDPOINT |
otelGrpcEndpoint |
Proxy pushes OTEL telemetry to this endpoint. Default value: http://localhost:4317 | No |
Troubleshooting
The proxy container doesn't start.
Run the following command to show any errors for the proxy container.kubectl --namespace <Namespace> describe pod <Prometheus-Pod-Name>`Proxy doesn't start - configuration errors
The proxy checks for a valid identity to fetch a token during startup. If it fails to retrieve a token, start up fails. Errors are logged and can be viewed by running the following command:
kubectl --namespace <Namespace> logs <Proxy-Pod-Name>Example output:
time="2023-05-15T11:24:06Z" level=info msg="Configuration settings loaded:" AAD_CLIENT_CERTIFICATE_PATH= AAD_CLIENT_ID=abc123de-be75-4141-a1e6-abc123987def AAD_TENANT_ID= AAD_TOKEN_REFRESH_INTERVAL_IN_PERCENTAGE=10 AUDIENCE="https://prometheus.monitor.azure.cn" IDENTITY_TYPE=userassigned LISTENING_PORT=8082 OTEL_GRPC_ENDPOINT= OTEL_SERVICE_NAME=aad_auth_proxy TARGET_HOST=proxytest-01-workspace-orkw.chinanorth.prometheus.monitor.azure.cn
2023-05-15T11:24:06.414Z [ERROR] TokenCredential creation failed:Failed to get access token: ManagedIdentityCredential authentication failed
GET http://169.254.169.254/metadata/identity/oauth2/token
--------------------------------------------------------------------------------
RESPONSE 400 Bad Request
--------------------------------------------------------------------------------
{
  "error": "invalid_request",
  "error_description": "Identity not found"
}
--------------------------------------------------------------------------------


