Note
Access to this page requires authorization. You can try signing in or changing directories.
Access to this page requires authorization. You can try changing directories.
Prometheus metrics are ingested into an Azure Monitor workspace. Azure monitor workspaces have default limits and quotas for ingestion. When you reach the ingestion limits, throttling can occur. In order to avoid throttling, you can monitor and alert on the workspace ingestion limits.
For more information on Prometheus and Azure Monitor workspace limits and quotas, see Azure Monitor service limits.
View limits
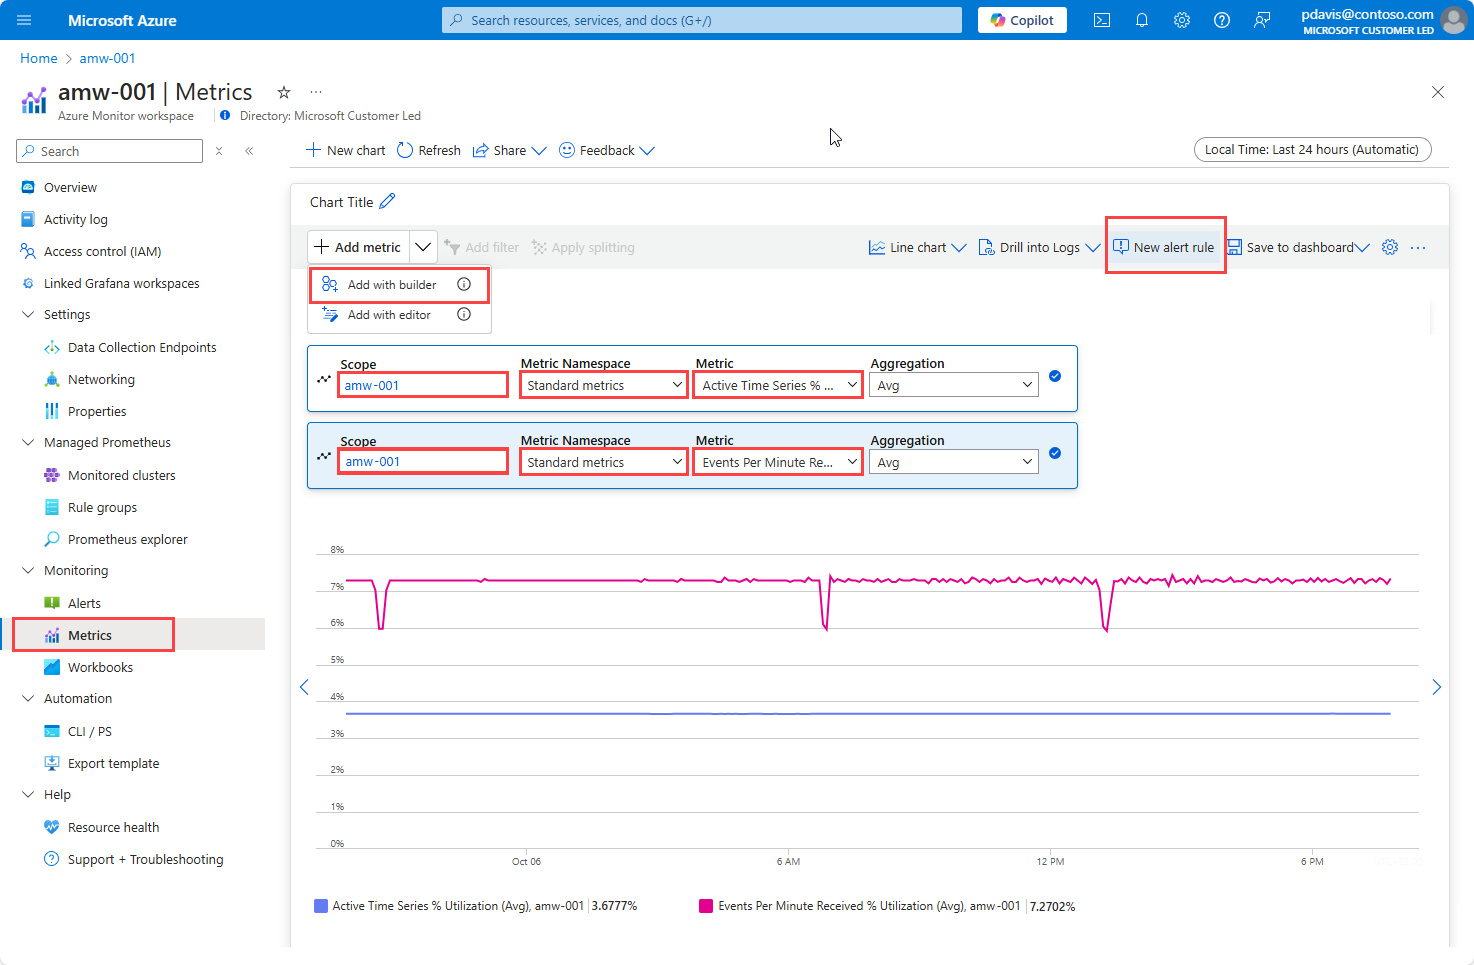
Azure Monitor Workspace exposes a set of metrics that provide insight into ingestion limits and utilization. In the Azure portal, navigate to your Azure Monitor workspace and select Metrics under the Monitoring section.
- In the Select metric dropdown, select View standard metrics with the builder.
- In the Add metric dropdown, select Add with builder.
- In the Metric drop-down, select Active Time Series % Utilization and Events Per Minute Received % Utilization and verify that they are below 100%.
Request for an increase in ingestion limits (Preview)
Request for an increase in ingestion limits using Azure Resource Manager API. This API is in Preview and below conditions apply with this API:
- Request for an increase in limit from the default 1 Million events/min or active Timeseries to up to 20 Million events/min or active Timeseries with an API update through cli or through ARM update. For limits above 20 Million, create a support ticket.
- For limit increase request up to 2 Million, request is autoapproved.
- For limit increase request above 2 Million, current ingestion usage should be at 50% of desired limit, that is, if the current limit is 5 Million, they can request for increase upto 10 Million. You can request up to 20 Million.
- For requests beyond 20 Million, create a support ticket.
- Creation of an Azure Monitor Workspace always applies the default limits. Creating an Azure Monitor Workspace with custom limits is not supported.
This document explains how to use the ARM API to update the data ingestion limits of your Azure Monitor Workspaces.
Prerequisites
A command-line tool to run the ARM template commands, such as Azure PowerShell, or Azure CLI.
Step 1: Download the ARM templates and update the parameters
Note
If you prefer Bicep over ARM (JSON), you can decompile the following template and parameters files. For more information, see Decompile a JSON Azure Resource Manager template to Bicep.
Download the ARM template files (AMWLimitIncrease-Template.json and AMWLimitIncrease-Parameters.json) and update the Parameters.json file with the subscription id, name of the resource group where the AMW is in, Name of the AMW, location of the AMW, and required ingestion limits (maximum is 20000000).
Step 2: Execute the ARM update
Run the below commands from the downloaded ARM templates folder:
Azure CLI
az cloud set -n AzureChinaCloud
az login
az account set --subscription <subscriptionId>
az deployment group create --name AmwLimits --resource-group <resourceGroupName> --template-file AMWLimitIncrease-Template.json --parameters AMWLimitIncrease-Parameters.json
Azure PowerShell
Connect-AzAccount
New-AzResourceGroupDeployment -Name AmwLimits -ResourceGroupName <resourceGroupName> -TemplateFile AMWLimitIncrease-Template.json -TemplateParameterFile AMWLimitIncrease-Parameters.json
Step 3: Verify if the limits are updated
To verify if the limits are updated successfully, you can go to the Azure portal, navigate to the Azure Monitor Workspace -> Metrics explorer -> In the Metric dropdown, select "View standard metrics with the builder", and then verify if the updated limits are applied to the "Active Time Series Limit" and "Events per minute Ingested Limit".
Troubleshoot issues with increasing ingestion limits using ARM API
If you see an error when using the API to request for a limit increase, check the error response to find the cause of the error.
Requested limit is above 20 Million: "ActiveTimeSeries quota requested exceeds the maximum limit of {MaxAutoApprovedActiveTimeSeries}": This error occurs when you request for a limit of 20 Million or more events/min or Active Timeseries. Currently the API only supports an increase up to 20M. You can request for more ingestion limit by creating a support ticket.
Usage is less compared to requested limit: The current utilization does not meet the criteria for MaxTimeSeries quota requested. This error occurs when your current ingestion is less than 50% of the requested limit. Reach the required usage threshold of 50% of desired limit before requesting an increase, or request a limit increase of up to 200% of your current usage. To check the current usage, go to the Azure portal, navigate to the Azure Monitor Workspace -> Metrics explorer -> In the Metric dropdown, select "View standard metrics with the builder," and then select "Active Time Series % Utilization" and "Events per minute received % Utilization".
Query and alert on workspace ingestion metrics
To query Azure Monitor workspace metrics to monitor the ingestion limits, use the following steps:
In the Azure portal, navigate to your Azure Monitor workspace and select Metrics under the Monitoring section.
In the Add metric dropdown, select Add with builder.
Select the Azure Monitor workspace as scope.
Select Standard metrics for the Metric Namespace.
In the Metric drop-down, select Active Time Series % Utilization and Events Per Minute Received % Utilization and verify that they are below 100%.
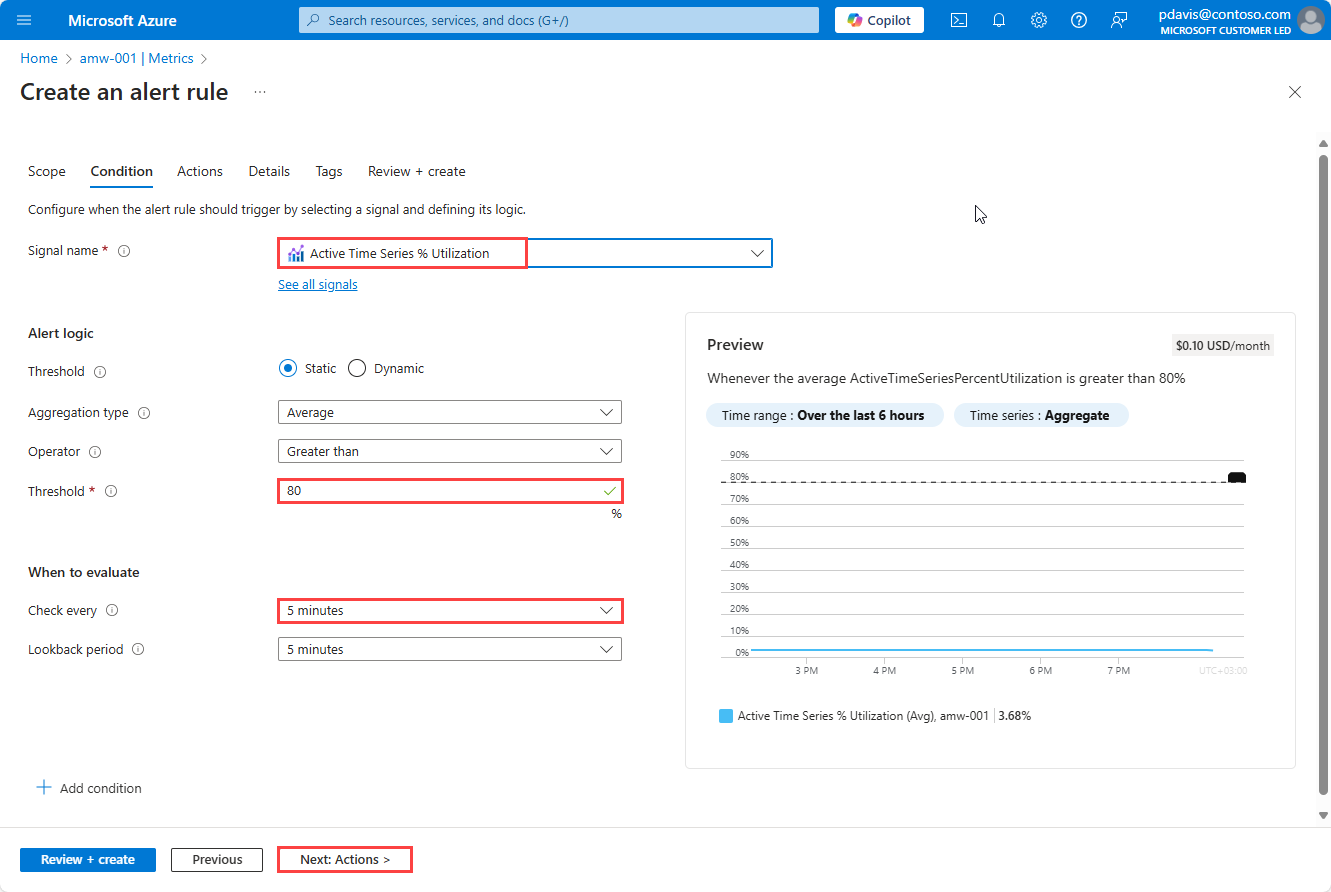
Select New alert rule to create an Azure alert. Set an Azure Alert to monitor the utilization and fire an alert when the utilization is greater than a certain threshold. For more information, see Create a metric alert for an Azure resource.
See your alerts in the Azure portal by selecting Alerts under the Monitoring section of your Azure Monitor workspace.
The alert is fired if the ingestion utilization is more than the threshold. Request an increase in the limit by creating a support ticket.

