Note
Access to this page requires authorization. You can try signing in or changing directories.
Access to this page requires authorization. You can try changing directories.
Azure Monitor managed service for Prometheus collects metrics from Azure Kubernetes clusters and stores them in an Azure Monitor workspace. Prometheus Query Language (PromQL) is a functional query language that you can use to query and aggregate time-series data. Use PromQL to query and aggregate metrics stored in an Azure Monitor workspace.
This article describes how to query an Azure Monitor workspace by using PromQL via the REST API. For more information on PromQL, see Query Prometheus.
To query an Azure monitor workspace by using PromQL, you need:
- An Azure Kubernetes cluster or remote Kubernetes cluster.
- Azure Monitor managed service for Prometheus scraping metrics from a Kubernetes cluster.
- An Azure Monitor workspace where Prometheus metrics are being stored.
To query your Azure Monitor workspace, authenticate by using Microsoft Entra ID. The API supports Microsoft Entra authentication by using client credentials. Register a client app with Microsoft Entra ID and request a token.
To set up Microsoft Entra authentication, follow these steps:
- Register an app with Microsoft Entra ID.
- Grant access for the app to your Azure Monitor workspace.
- Request a token.
To register an app, follow the steps in Register an app to request authorization tokens and work with APIs.
Assign the Monitoring Data Reader role to your app so that it can query data from your Azure Monitor workspace.
Open your Azure Monitor workspace in the Azure portal.
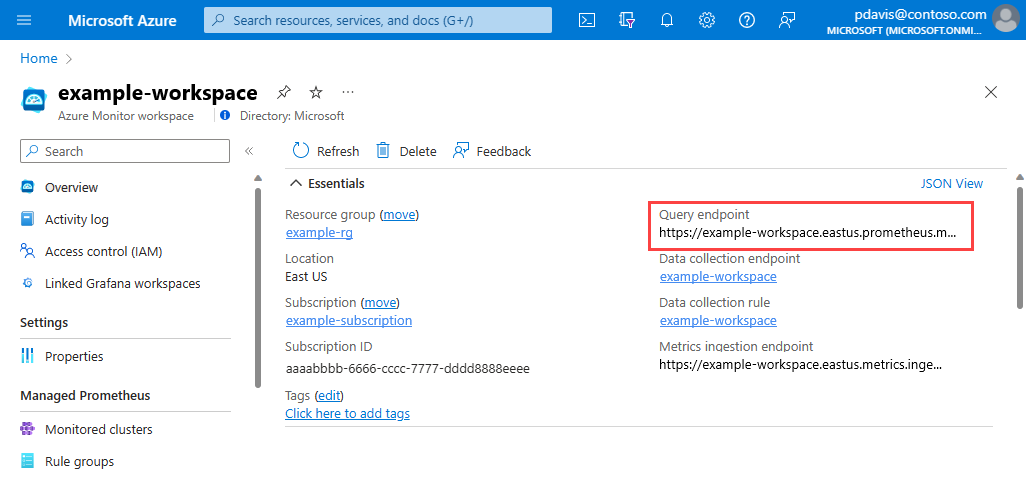
On the Overview page, note your query endpoint for use in your REST request.
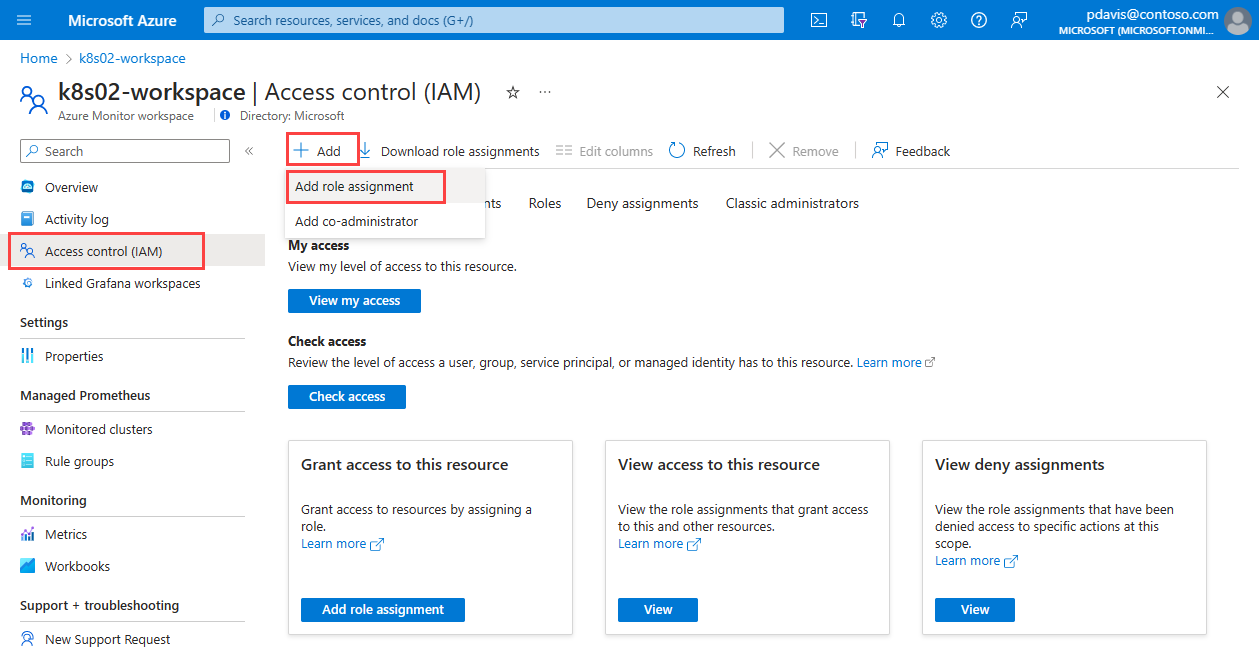
Select Access control (IAM).
On the Access control (IAM) page, select Add > Add role assignment.
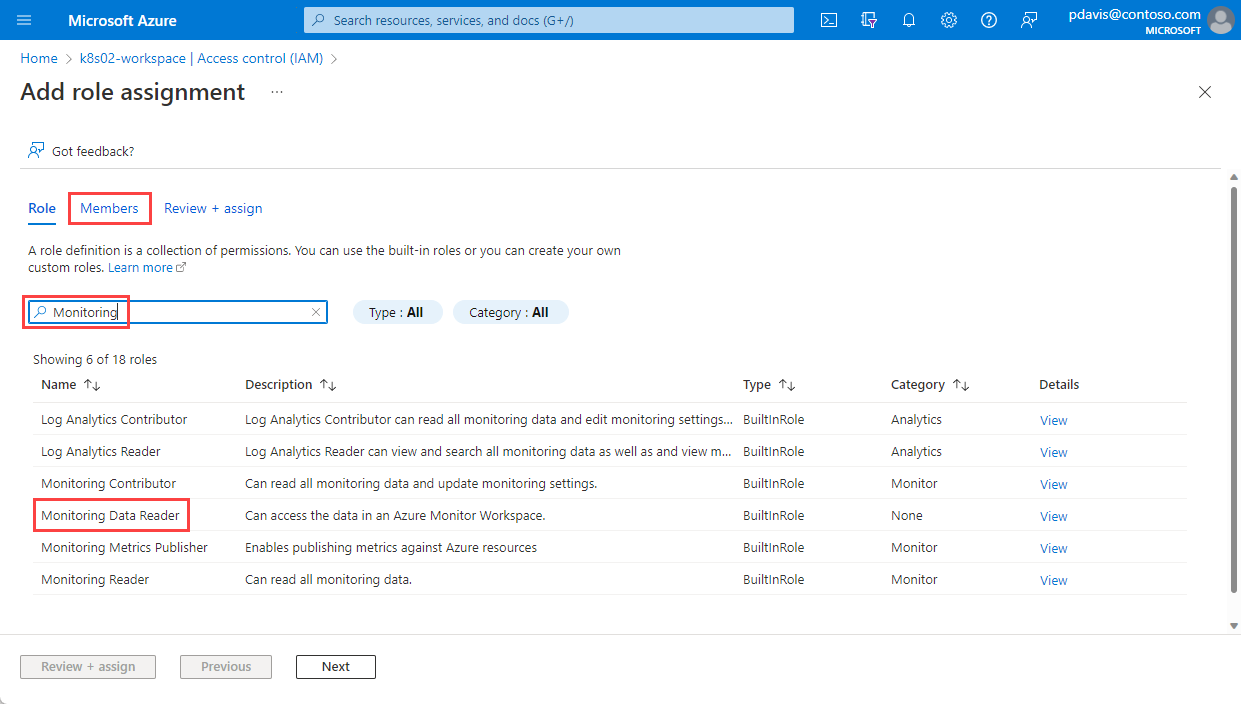
On the Add role assignment page, search for Monitoring.
Select Monitoring Data Reader, and then select the Members tab.
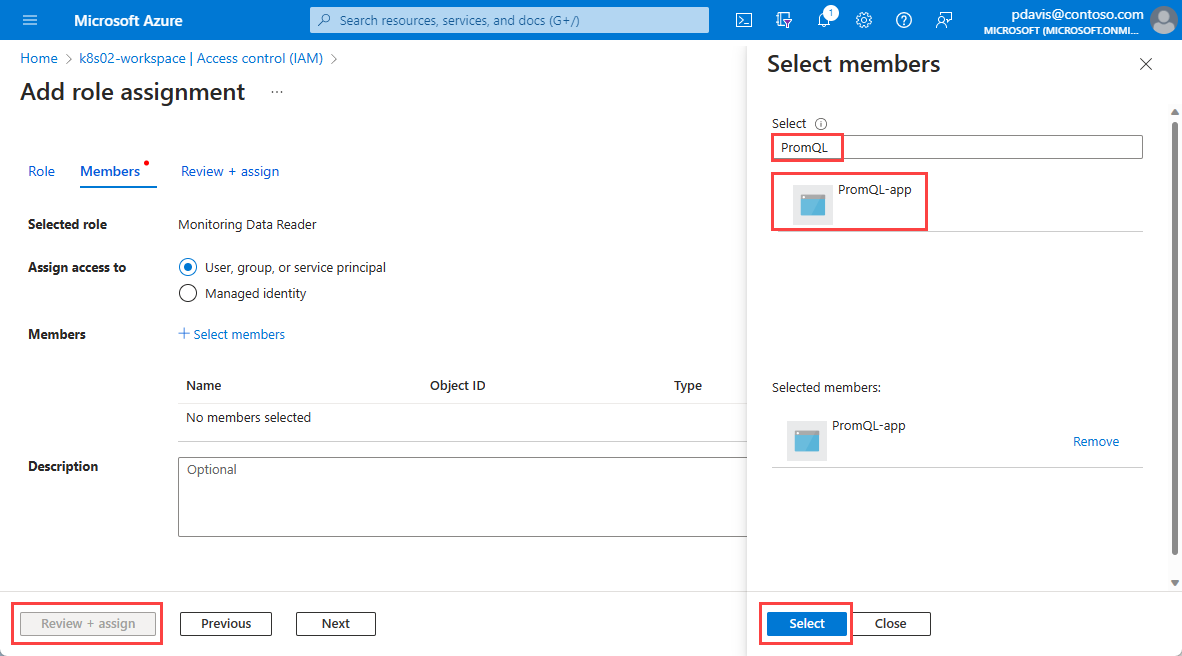
Choose Select members.
Search for the app that you registered and select it.
Choose Select.
Select Review + assign.
You created your app registration and assigned it access to query data from your Azure Monitor workspace. You can now generate a token and use it in a query.
Send the following request in the command prompt or by using a client like Insomnia or the PowerShell Invoke-RestMethod command.
curl -X POST 'https://login.partner.microsoftonline.cn/<tenant ID>/oauth2/token' \
-H 'Content-Type: application/x-www-form-urlencoded' \
--data-urlencode 'grant_type=client_credentials' \
--data-urlencode 'client_id=<your apps client ID>' \
--data-urlencode 'client_secret=<your apps client secret>' \
--data-urlencode 'resource=https://prometheus.monitor.azure.cn'
{
    "token_type": "Bearer",
    "expires_in": "86399",
    "ext_expires_in": "86399",
    "expires_on": "1672826207",
    "not_before": "1672739507",
    "resource": "https:/prometheus.monitor.azure.cn",
    "access_token": "eyJ0eXAiOiJKV1Qi....gpHWoRzeDdVQd2OE3dNsLIvUIxQ"
}
Save the access token from the response for use in the following HTTP requests.
Find your Azure Monitor workspace's query endpoint on the Azure Monitor workspace Overview page.
The following queries are supported.
For more information, see Instant queries.
Path: /api/v1/query
POST https://k8s-02-workspace-abcd.chinanorth3.prometheus.monitor.azure.cn/api/v1/query
--header 'Authorization: Bearer <access token>'
--header 'Content-Type: application/x-www-form-urlencoded'
--data-urlencode 'query=sum( \
    container_memory_working_set_bytes \
    * on(namespace,pod) \
    group_left(workload, workload_type) \
    namespace_workload_pod:kube_pod_owner:relabel{ workload_type="deployment"}) by (pod)'
GET 'https://k8s02-workspace-abcd.chinanorth3.prometheus.monitor.azure.cn/api/v1/query?query=container_memory_working_set_bytes'
--header 'Authorization: Bearer <access token>'
For more information, see Range queries.
Path: /api/v1/query_range
GET 'https://k8s02-workspace-abcd.chinanorth3.prometheus.monitor.azure.cn/api/v1/query_range?query=container_memory_working_set_bytes&start=2023-03-01T00:00:00.000Z&end=2023-03-20T00:00:00.000Z&step=6h'
--header 'Authorization: Bearer <access token>
POST 'https://k8s02-workspace-abcd.chinanorth3.prometheus.monitor.azure.cn/api/v1/query_range'
--header 'Authorization: Bearer <access token>'
--header 'Content-Type: application/x-www-form-urlencoded'
--data-urlencode 'query=up'
--data-urlencode 'start=2023-03-01T20:10:30.781Z'
--data-urlencode 'end=2023-03-20T20:10:30.781Z'
--data-urlencode 'step=6h'
For more information, see Series.
Path: /api/v1/series
POST 'https://k8s02-workspace-abcd.chinanorth3.prometheus.monitor.azure.cn/api/v1/series'
--header 'Authorization: Bearer <access token>
--header 'Content-Type: application/x-www-form-urlencoded'
--data-urlencode 'match[]=kube_pod_info{pod="bestapp-123abc456d-4nmfm"}'
GET 'https://k8s02-workspace-abcd.chinanorth3.prometheus.monitor.azure.cn/api/v1/series?match[]=container_network_receive_bytes_total{namespace="default-1669648428598"}'
For more information, see Labels.
Path: /api/v1/labels
GET 'https://k8s02-workspace-abcd.chinanorth3.prometheus.monitor.azure.cn/api/v1/labels'
POST 'https://k8s02-workspace-abcd.chinanorth3.prometheus.monitor.azure.cn/api/v1/labels'
For more information, see Label values.
Path: /api/v1/label/__name__/values
Note
The only supported version of this API is __name__, and it returns all metric names. No other /api/v1/label/<label_name>/values are supported.
GET 'https://k8s02-workspace-abcd.chinanorth3.prometheus.monitor.azure.cn/api/v1/label/__name__/values'
For the full specification of open-source software Prometheus APIs, see Prometheus HTTP API.
The following limitations are in addition to the limitations that are described in the Prometheus specification:
Any time-series fetch queries (
/seriesor/queryor/query_range) must contain a\_\_name\_\_label matcher. That is, each query must be scoped to a metric. There can be only one\_\_name\_\_label matcher in a query.The query
/seriesdoesn't support regular expression filter.Supported time range:
- The
/query_rangeAPI supports a time range of 32 days. This length of time is the maximum time range allowed, including range selectors specified in the query itself. For example, the queryrate(http_requests_total[1h]for the last 24 hours means that data is queried for 25 hours. This number comes from the 24-hour range plus the 1 hour specified in the query itself. - The
/seriesAPI fetches data for a maximum 12-hour time range. IfendTimeisn't provided, thenendTime = time.now(). If the time range is greater than 12 hours,startTimeis set toendTime - 12h.
- The
The start time and end time provided with
/labelsand/label/__name__/valuesare ignored. All retained data in the Azure Monitor workspace is queried.Experimental features such as exemplars aren't supported.
For more information on Prometheus metrics limits, see Prometheus metrics.
Azure Monitor managed service for Prometheus is a case-insensitive system. It treats strings (such as metric names, label names, or label values) as the same time series if they differ from another time series only by the case of the string.
Note
This behavior is different from native open-source Prometheus, which is a case-sensitive system. Self-managed Prometheus instances running in Azure virtual machines, virtual machine scale sets, or Azure Kubernetes Service clusters are case-sensitive systems.
In managed service for Prometheus, the following time series are considered the same:
diskSize(cluster="chinanorth3", node="node1", filesystem="usr_mnt")
diskSize(cluster="chinanorth3", node="node1", filesystem="usr_MNT")
The preceding examples are a single time series in a time series database. The following considerations apply:
- Any samples ingested against them are stored as if they're scraped or ingested against a single time series.
- If the preceding examples are ingested with the same time stamp, one of them is randomly dropped.
- The casing that's stored in the time series database and returned by a query is unpredictable. The same time series might return different casing at different times.
- Any metric name or label name/value matcher present in the query is retrieved from the time series database through a case-insensitive comparison. If there's a case-sensitive matcher in a query, it's automatically treated as a case-insensitive matcher in string comparisons.
It's a best practice to use a single consistent case to produce or scrape a time series.
Open-source Prometheus treats the preceding examples as two different time series. Any samples scraped or ingested against them are stored separately.
This section provides answers to common questions.
Use the Troubleshooting guide to learn how to ingest Prometheus metrics from the managed agent.
Azure Managed Prometheus is a case-insensitive system. It treats strings, such as metric names, label names, or label values, as the same time series if they differ from another time series only by the case of the string. For more information, see Prometheus metrics overview.
During node updates, you might see a one-minute to two-minute gap in metric data for metrics collected from our cluster-level collectors. This gap occurs because the node that the data runs on is being updated as part of a normal update process. This update process affects cluster-wide targets such as kube-state-metrics and custom application targets that are specified. This process occurs when your cluster is updated manually or via automatic update.
This behavior is expected and doesn't affect any of our recommended alert rules.


