Note
Access to this page requires authorization. You can try signing in or changing directories.
Access to this page requires authorization. You can try changing directories.
Ingestion errors are issues that occurred during data ingestion. Error conditions in this category might suggest data loss, so they're important to monitor. These errors may include indications of reaching the Azure Monitor workspace ingestion limits. For service limits for Azure Monitor workspaces, see Azure Monitor service limits.
Important
This feature is currently in preview and may be subject to change. Support for this feature is limited. See the Supplemental Terms of Use for Azure Previews for legal terms that apply to Azure features that are in beta, preview, or otherwise not yet released into general availability.
Monitor ingestion Errors
To monitor errors in data ingestion for Azure Monitor workspace metrics, use the following steps:
In the Azure portal, navigate to your Azure Monitor workspace and select Metrics under the Monitoring section.
In the Add metric dropdown, select Add with builder.
Select the Azure Monitor workspace as scope.
Select Standard metrics for the Metric Namespace.
In the Metric drop-down, select Events Dropped and Time Series Samples Dropped to check for any errors in data ingestion.
Click on Apply splitting, and in the Values dropdown, select Reason.


Events dropped
The events dropped metric indicates the number of events received but not accepted into Azure Monitor Workspace. It includes a Reason dimension to indicate why events aren't accepted. The set of reasons are subject to change in the future to provide better fidelity. The following table describes the set of reasons and what conditions result in them.
| Reason | Description |
|---|---|
| OldData | Data was dropped because events have timestamps older than 20 minutes. Only events with timestamps no more than 20 minutes in the past or 20 minutes in the future (relative to ingestion time) are accepted. |
| LimitThrottling | Data was dropped because ingestion limits were exceeded. Request an increase in ingestion limits |
| BadInputFormat | Data was dropped because the input format was invalid. For valid input formats, see Metric names, label names & label values |
| InternalError | Data was dropped because of an internal error. |
Time series samples dropped
The time series samples dropped metric indicates the number of datapoints dropped during processing (after the corresponding event was accepted). It includes a Reason dimension to indicate why the datapoints were dropped. The set of reasons are subject to change in the future to provide better fidelity. The following table describes the set of reasons and what conditions result in them.
| Reason | Description |
|---|---|
| Duplicate | Data was a duplicate of already received data. |
| OutOfOrder | Data was received out of order; the data received for a time series had an older timestamp than other data already ingested for the same time series. |
| LimitThrottling | Data was rejected because new time series are throttled at the monitoring account level. Request an increase in ingestion limits |
| InvalidTimeRange | Data was rejected because it contained a timestamp too far in future. Only events with timestamps no more than 20 minutes in the future (relative to ingestion time) are accepted. |
| OldData | Data was rejected because it was too old. Only events with timestamps no more than 20 minutes in the past (relative to ingestion time) are accepted. |
| InternalError | Update has failed due to an internal error. |
| ReservedDimensionName | Data was rejected because it contained one or more dimension key(s)/label name(s) that conflicts with reserved dimension/label name(s). |
| BadInputFormat | Data was dropped because it contained values outside of the supported data range. For valid input formats, see Metric names, label names & label values |
Monitor ingestion requests for Data Collection Rule (Preview)
When you set up Azure Monitor Workspace, there are limits applying to the associated data collection rules (DCR) that send Prometheus metrics to the Azure Monitor workspace. For information on these limits, see Prometheus Service limits.
To view and monitor if the DCR limits are being throttled, use the following steps:
- In the Azure portal, navigate to your Azure Monitor workspace and click on the Data Collection Rule that is displayed on the Overview page.
- On the Data Collection Rule page, go to Monitoring -> Metrics
- In the Select Metric drop-down, select Metrics Ingestion Requests per Min to view the no. of metrics ingestion requests per minute.
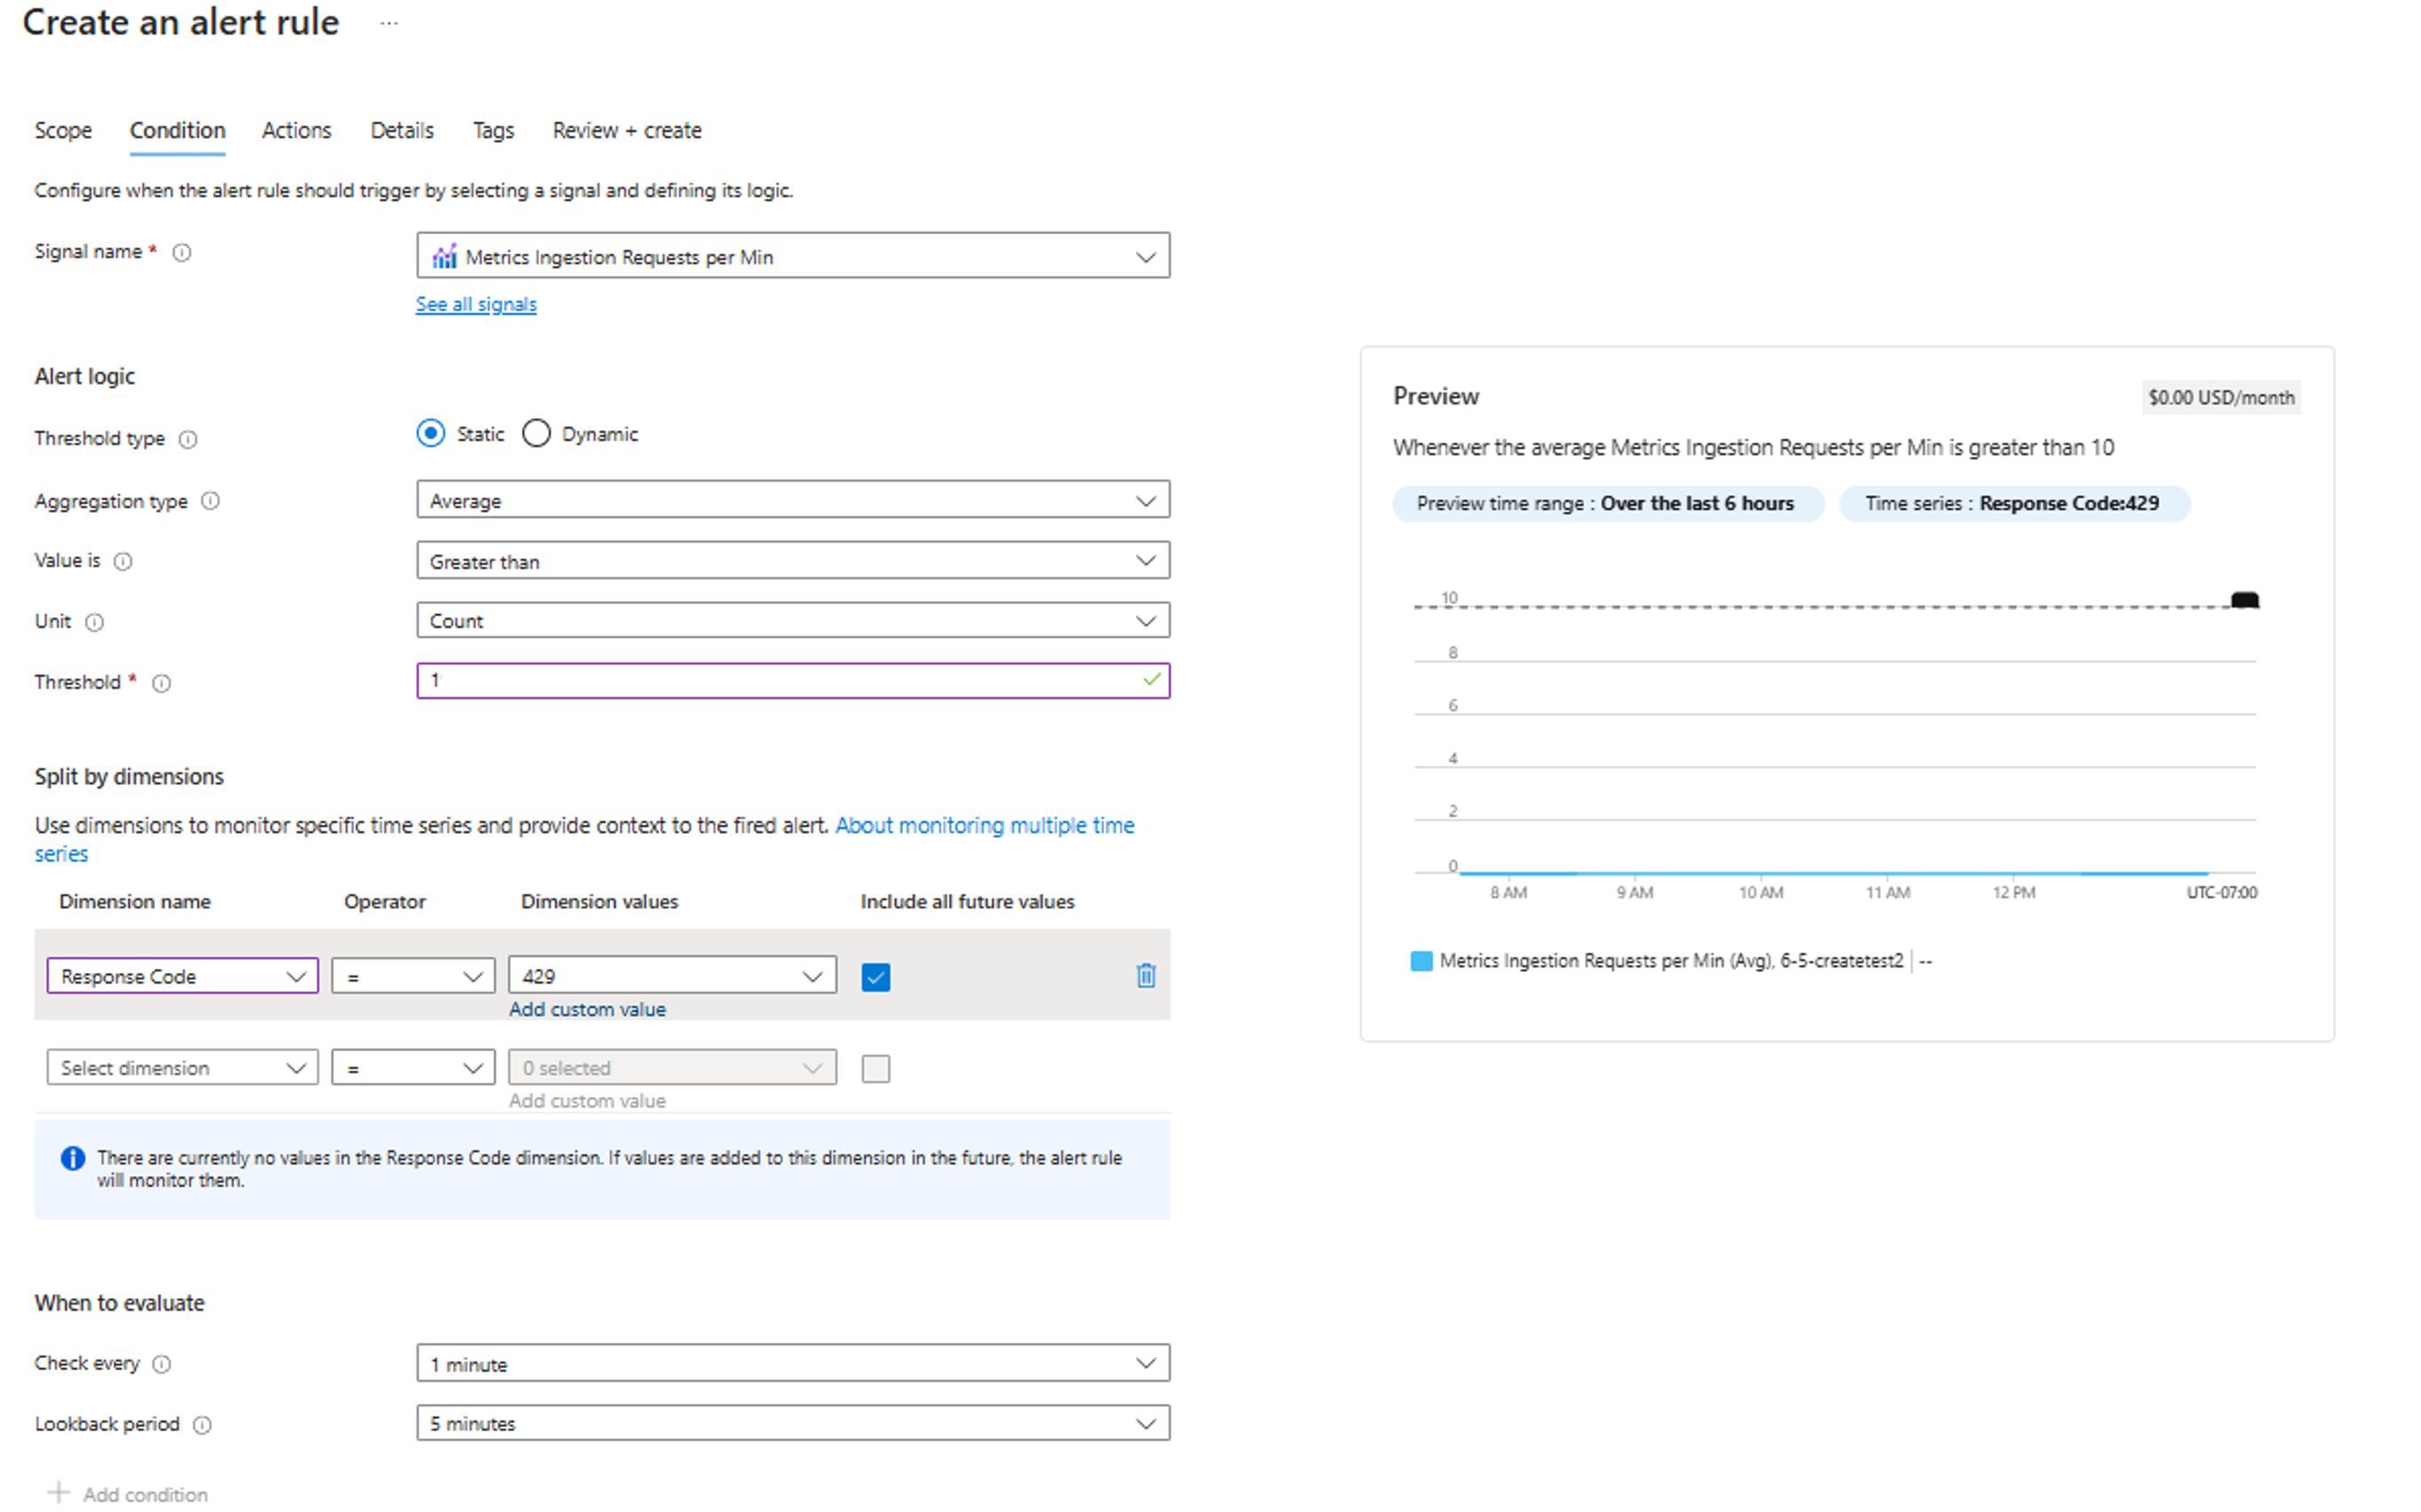
Create an alert to monitor DCR limits
To monitor if the DCR metrics ingestion is getting throttled, you can create an alert on the dimension Response code of the metrics. In case of throttling, the "Response code" will contain 429 error code.
On the Data Collection Rule page, go to Monitoring -> Alerts.
Click on + Create -> Alert rule.
Click on "See all signals", and then Metrics Ingestion Requests per Min under Metrics section. Click Apply.
Review the details and enter the threshold; In the Split by dimensions section, select Response code from the "Dimension name" dropdown, and enter "429" as the dimension value.
Review other details and create the alert.

In case you get an alert, consider creating additional DCRs and DCEs to distribute the ingestion load across multiple endpoints. This approach helps optimize performance and ensures efficient data handling. For more information about creating DCRs and DCEs, see How to create custom Data collection endpoint(DCE) and custom Data collection rule(DCR) for an existing Azure monitor workspace to ingest Prometheus metrics.
Note
These metrics are currently in preview and support for these metrics are limited. If needed, you can create an alert for metrics dropped beyond a certain threshold, and in case such an alert is received, please review your data collection configurations for the specific conditions as described above.