Note
Access to this page requires authorization. You can try signing in or changing directories.
Access to this page requires authorization. You can try changing directories.
Azure Monitor dashboards with Grafana allow you to use and create Grafana dashboards directly in the Azure portal. This article explains how to create dashboards with data from Azure Data Explorer (ADX).
Prerequisites
- Existing Azure Data Explorer cluster
- Database viewer role or higher on the relevant ADX cluster
Select the Azure Data Explorer data
Use the following process to add Azure Data Explorer data to a new or existing Grafana dashboard.
- Either create a new dashboard or add a visualization to an existing dashboard.
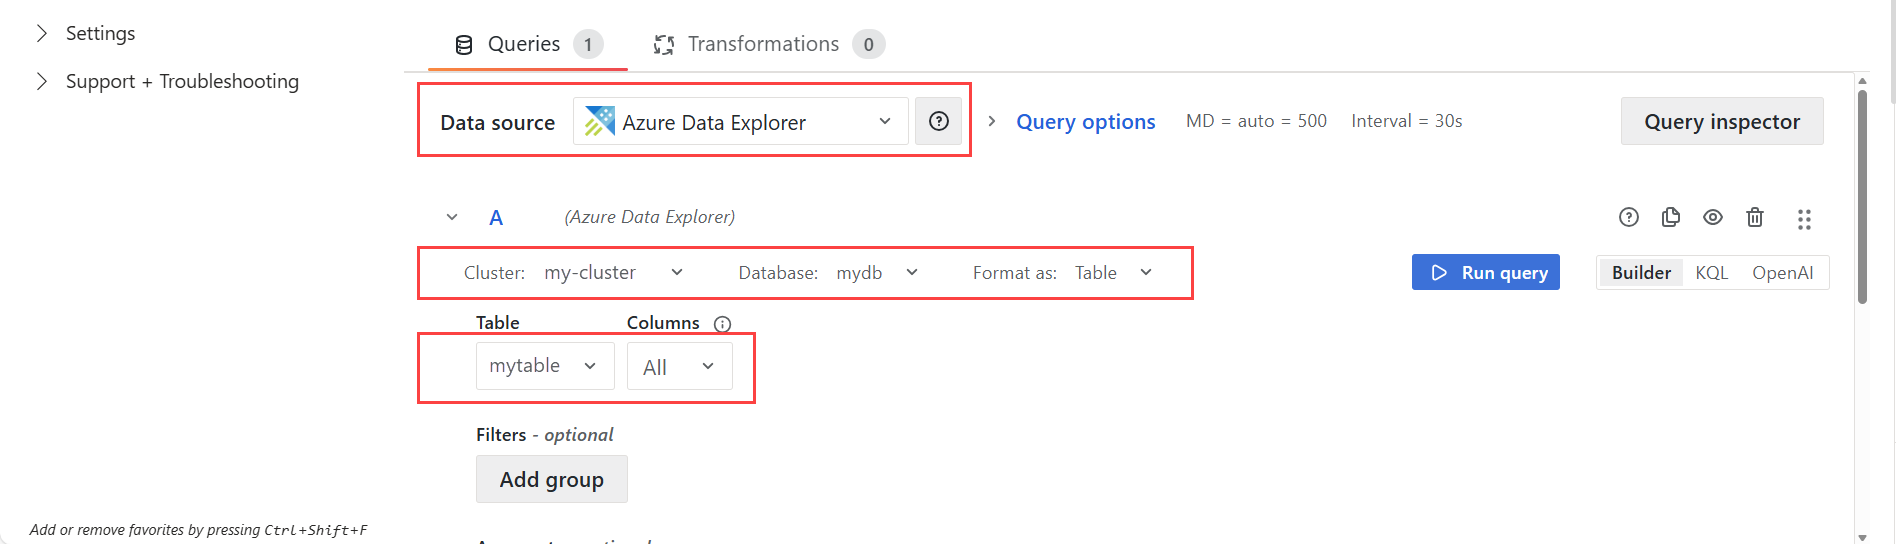
- Select Azure Data Explorer for the Data source.
- Select a cluster from the Cluster dropdown list OR manually enter the URL for the cluster.
- Select a Database and Table with the data you want.
- Use the query editor to write a KQL (Kusto) query to retrieve the data that should populate the dashboard.
Import ADX dashboard JSON
If you have existing dashboards in Grafana that use the Azure Data Explorer data source, you can use the following process to import them into Azure Monitor dashboards with Grafana.
- Export the JSON for the dashboard from Grafana.
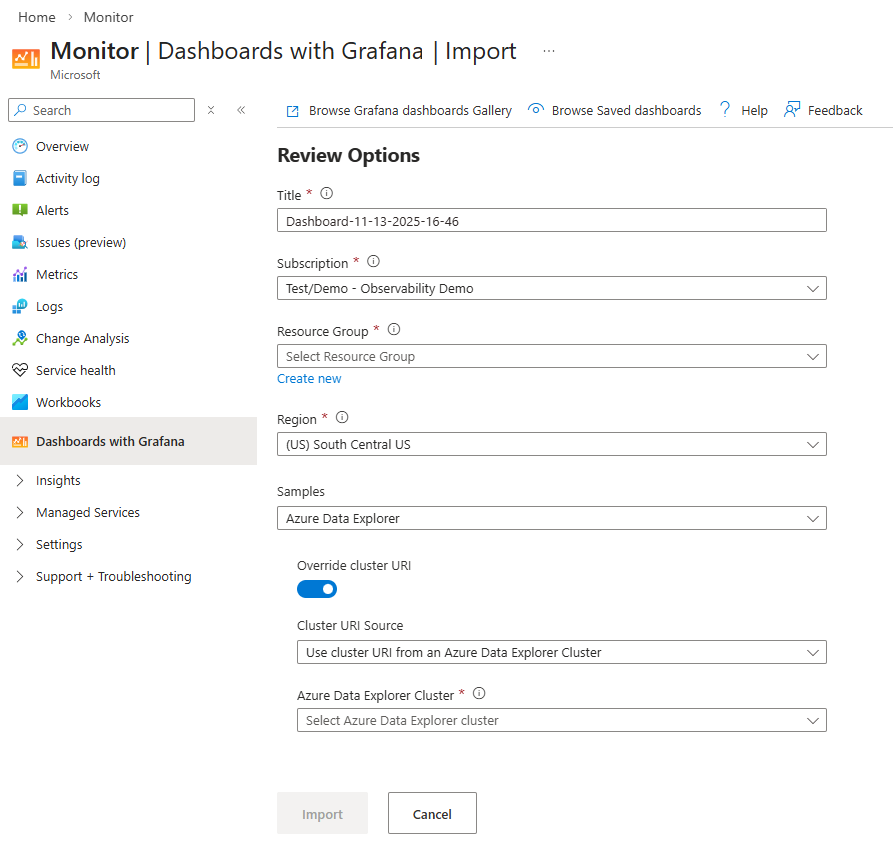
- From the dashboards with Grafana screen, select New > Import. The import screen appears.
- Select the option to import the JSON file and select the saved JSON.
- Select a subscription from the Subscription dropdown list that has the resource provider.
- Select Azure Data Explorer for the data source.
- Select the cluster to be included in the dashboard.
- If you don't see the cluster in the list, select the Override cluster URI toggle, and then select Enter Azure Data Explorer cluster URI manually from the Cluster URI Source dropdown list. Enter the URL of the cluster in the Cluster URI field.
- Select Import.