Note
Access to this page requires authorization. You can try signing in or changing directories.
Access to this page requires authorization. You can try changing directories.
Modern applications are often complex and highly distributed with many discrete parts working together to deliver a service. Because of this complexity, Azure Monitor provides monitoring insights for resource groups. This feature makes it easy to triage and diagnose any problems that your resources encounter. It offers context about the health and performance of the resource group and your application.
Access insights for resource groups
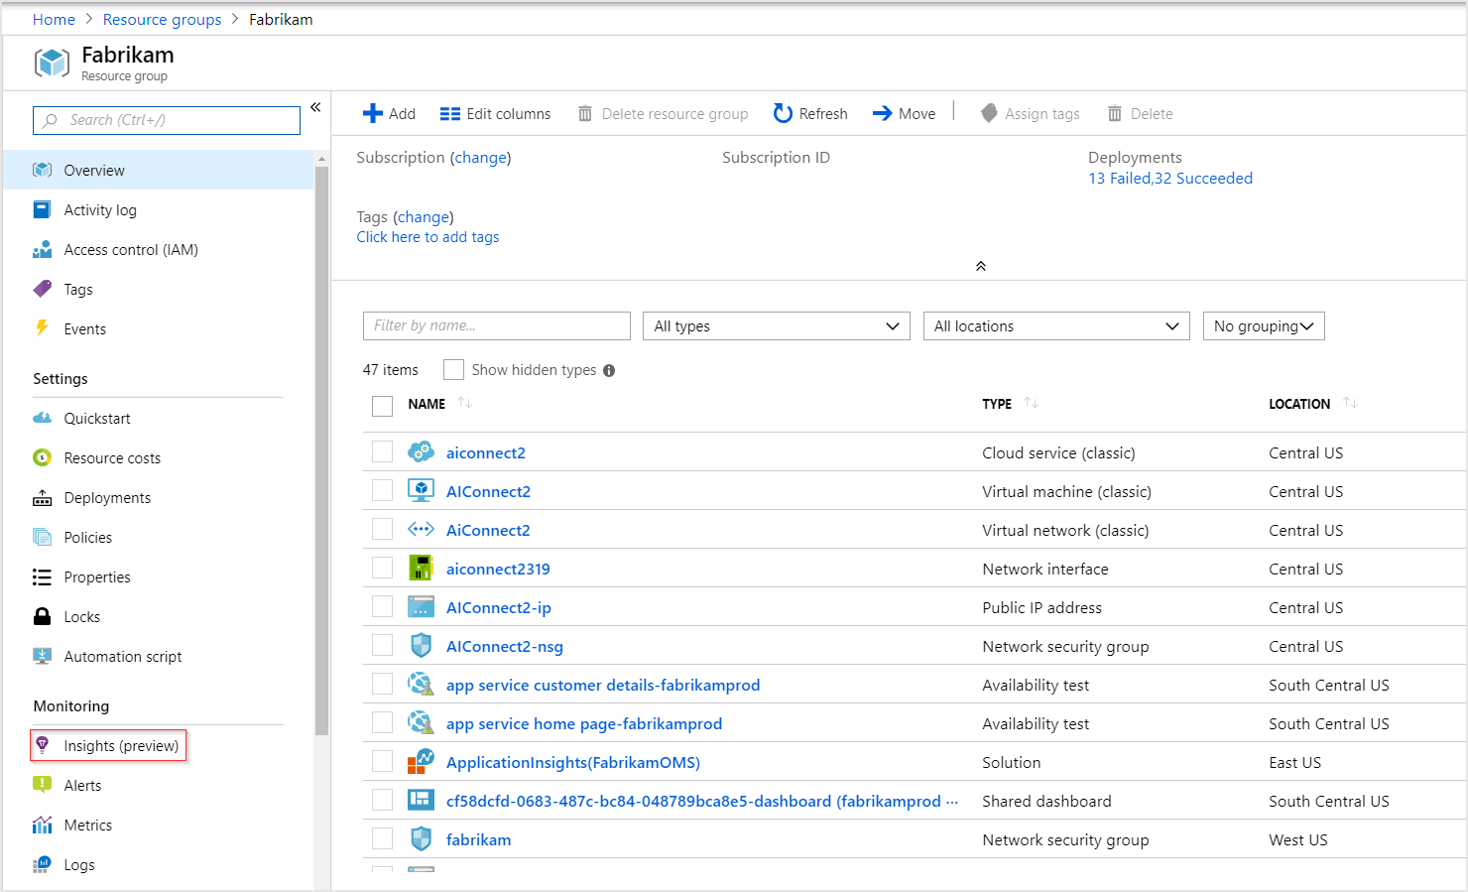
- Select Resource groups from the left-side navigation bar.
- Pick one of your resource groups that you want to explore. (If you have a large number of resource groups, filtering by subscription can sometimes be helpful.)
- To access insights for a resource group, select Insights in the left-side menu of any resource group.
Resources with active alerts and health issues
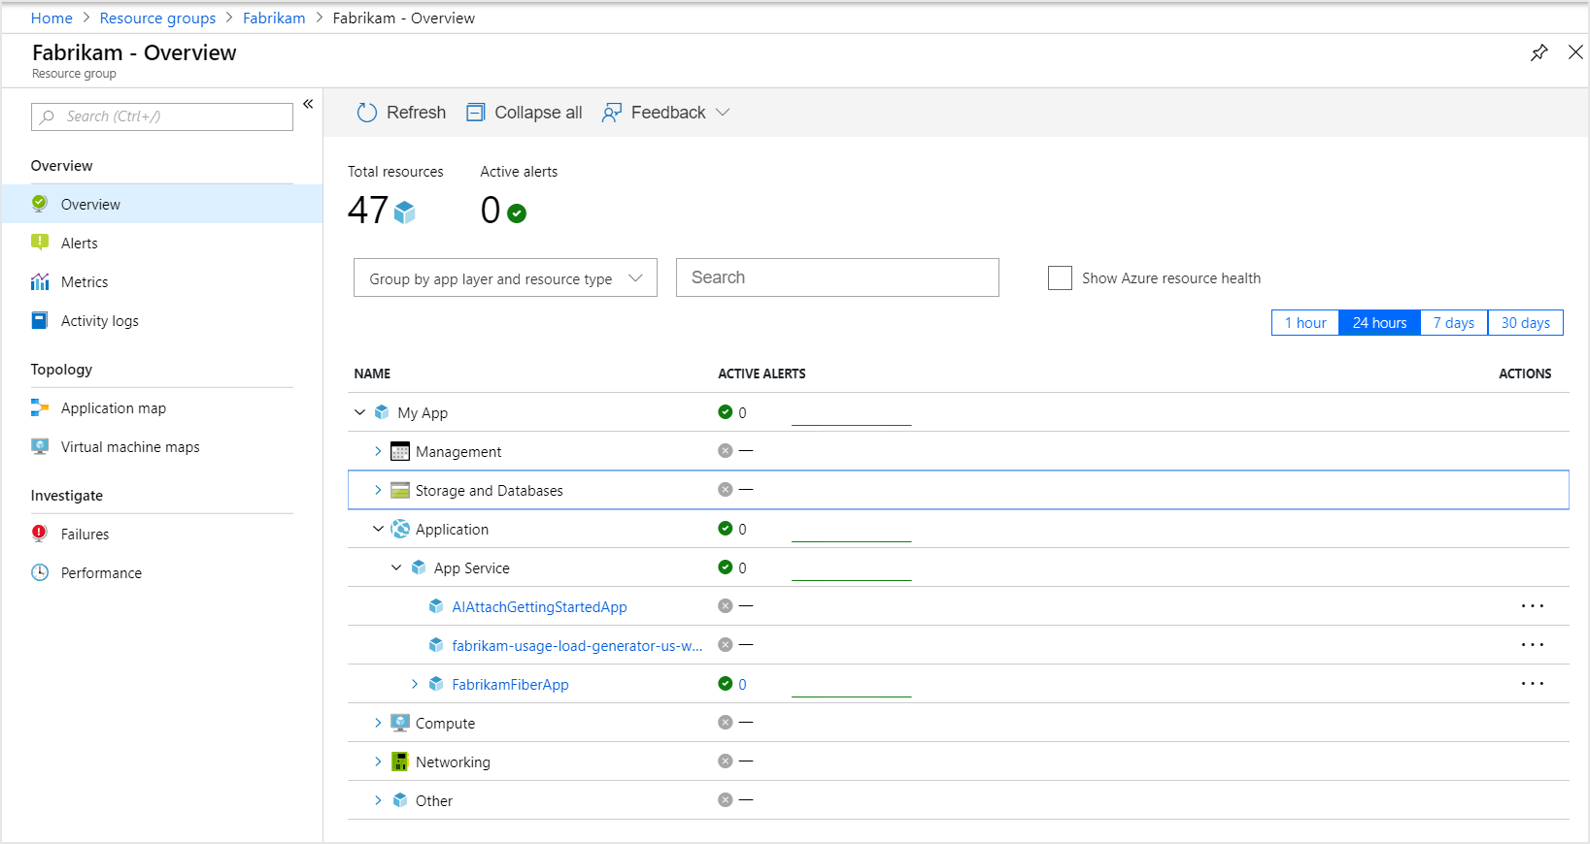
The overview page shows how many alerts are active, along with the current Azure Resource Health of each resource. Together, this information can help you quickly spot any resources that are experiencing issues. Alerts help you detect issues in your code and how you configured your infrastructure. Azure Resource Health surfaces issues with the Azure platform itself, that aren't specific to your individual applications.
Azure Resource Health
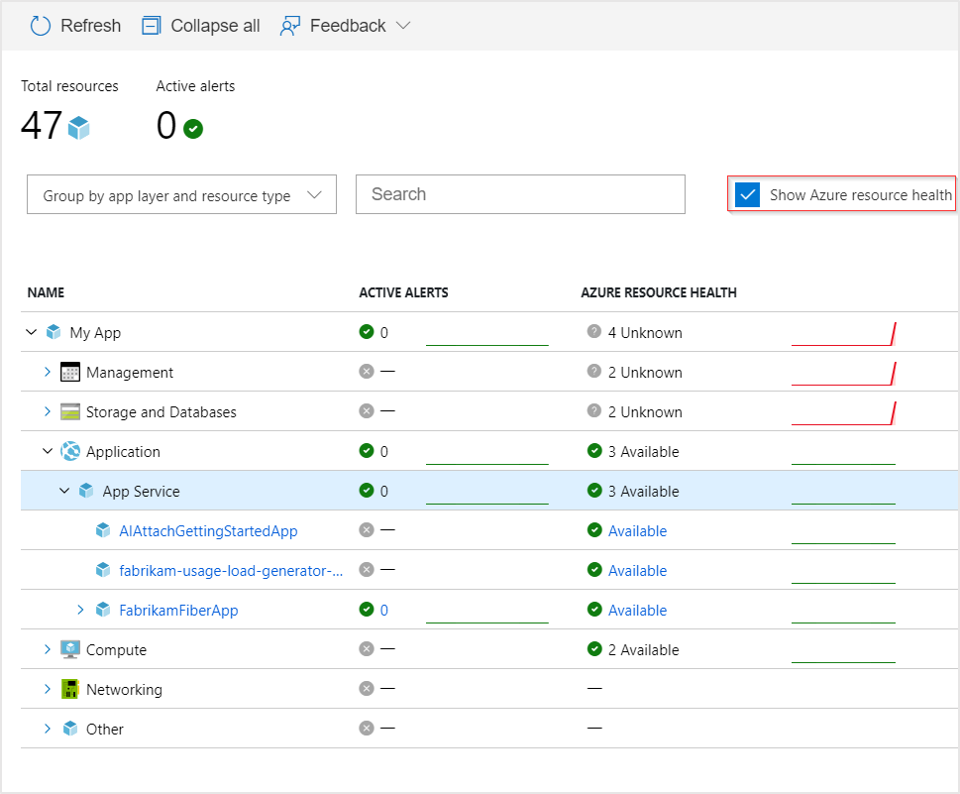
To display Azure Resource Health, check the Show Azure Resource Health box located above the table. This column is hidden by default to help the page load quickly.
By default, the table groups the resources by app layer and resource type. App layer is a simple categorization of resource types that exists only within the context of the resource group insights overview page. There are resource types related to application code, compute infrastructure, networking, storage, and databases. Management tools have their own app layers. Every other resource belongs to the Other app layer. This grouping helps you see at-a-glance what subsystems of your application are healthy and unhealthy.
Diagnose issues in your resource group
The resource group insights page provides several tools to help you diagnose issues.
| Tool | Description |
|---|---|
| Alerts | View, create, and manage your alerts. |
| Metrics | Visualize and explore your metric based data. |
| Activity logs | Subscription level events that occurred in Azure. |
| Application map | Navigate your distributed application's topology to identify performance bottlenecks or failure hotspots. |
Failures and performance
What if your application is running slowly, or users report errors? It's time consuming to search through all of your resources to isolate problems.
The Performance and Failures tabs simplify this process by bringing together performance and failure diagnostic views for many common resource types.
Most resource types open a gallery of Azure Monitor Workbook templates. You can customize, save, share, and reuse each workbook you create to diagnose similar issues in the future.
Investigate failures
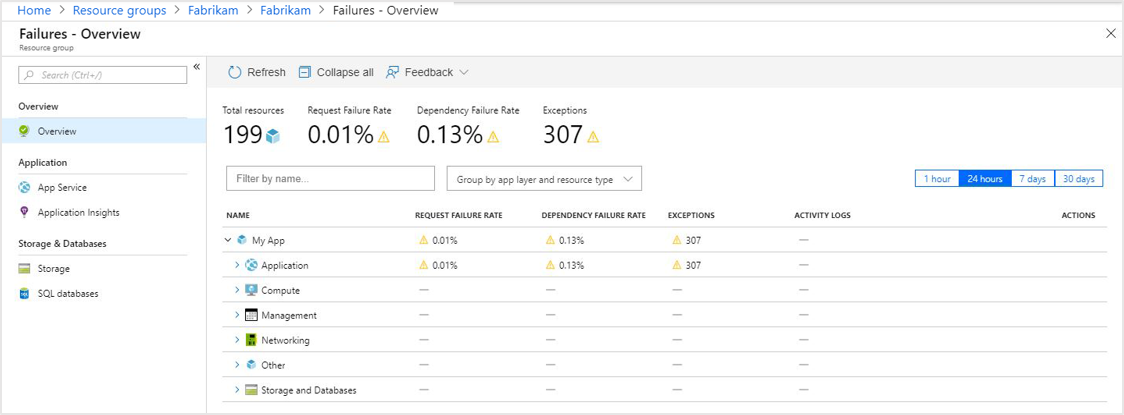
To test the Failures tab, select Failures under Investigate in the left-hand menu.
The left-side menu bar changes after your selection, offering you new options.
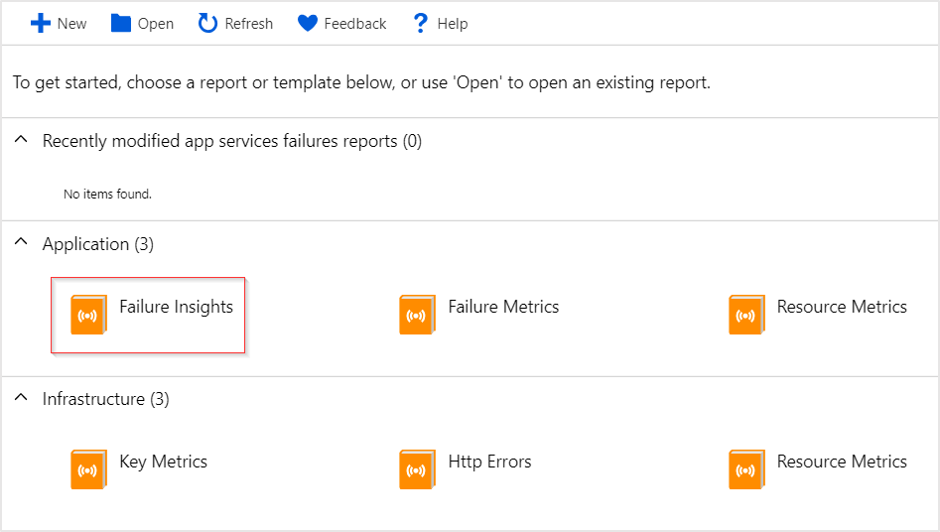
When you choose App Service, you're presented with a gallery of Azure Monitor Workbook templates.
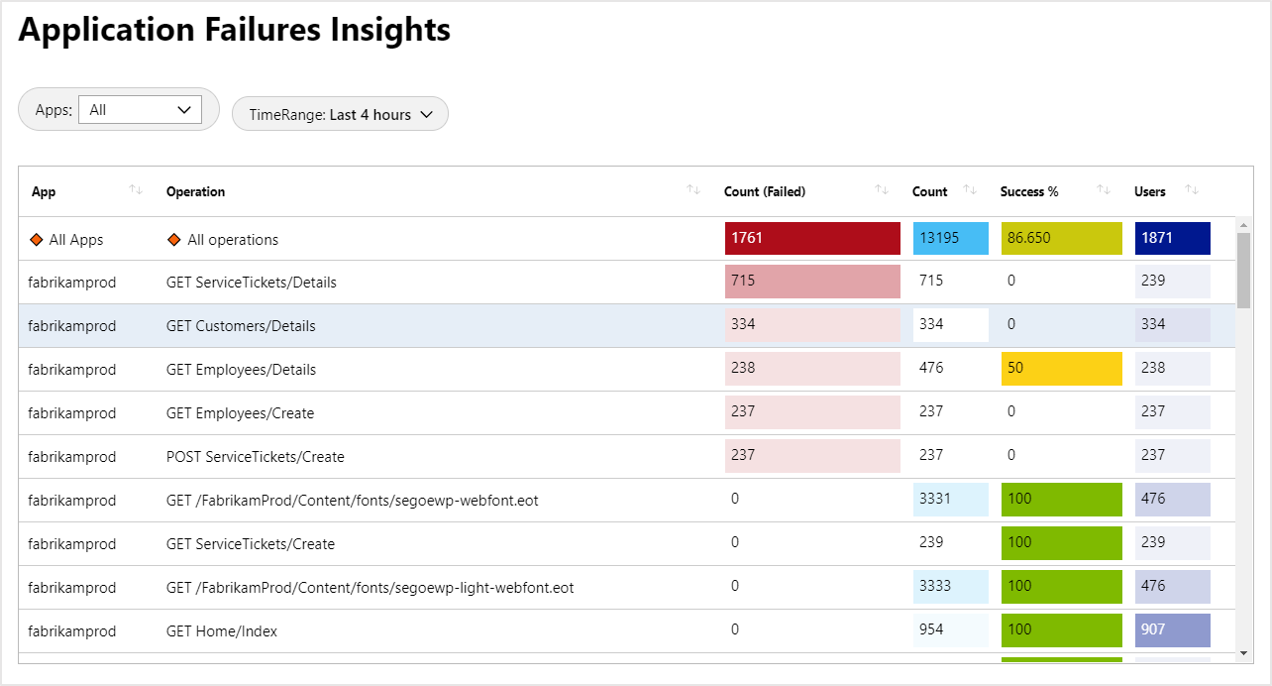
Choosing the template for Failure Insights opens the workbook.
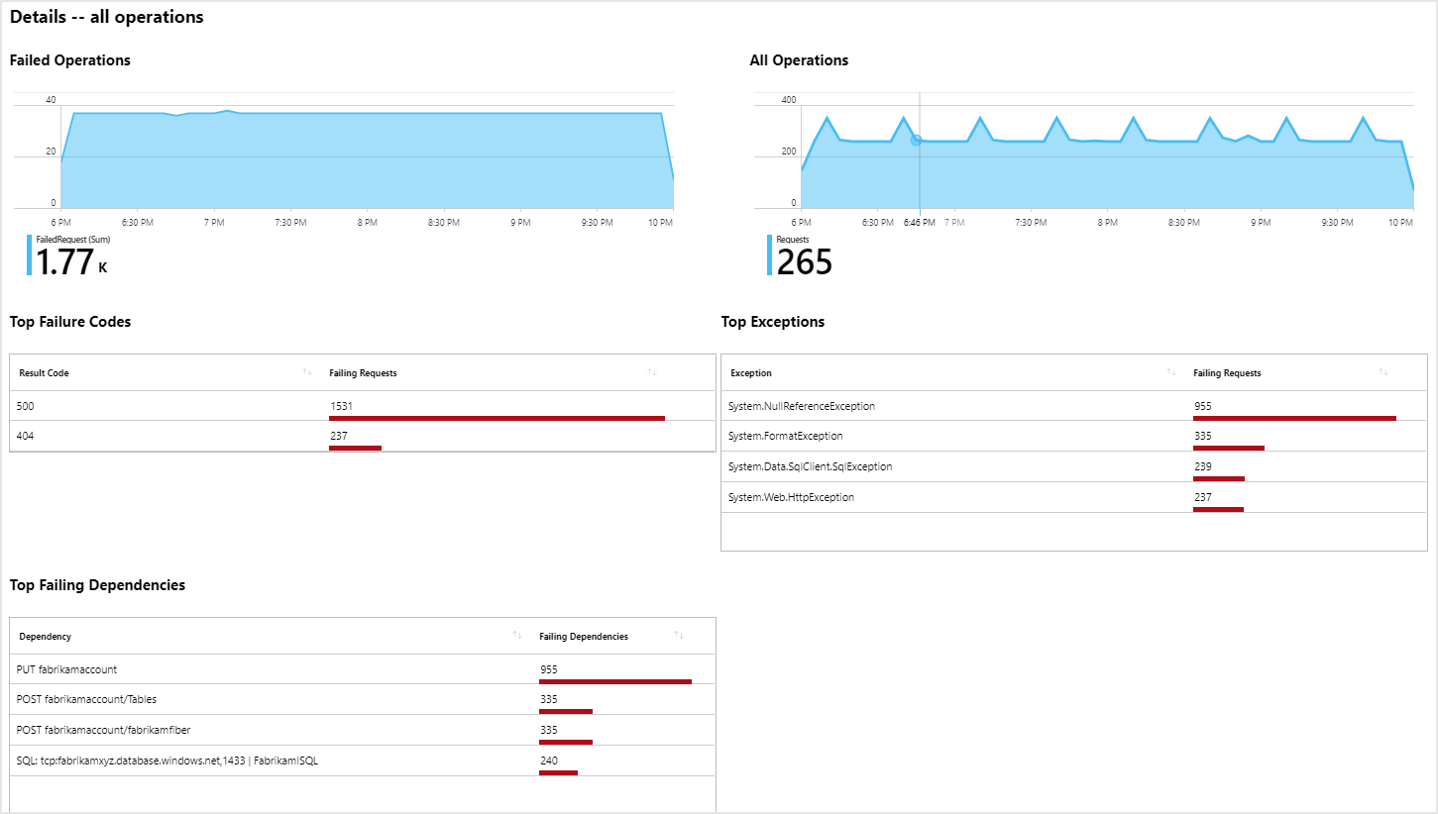
You can select any of the rows. The selection is then displayed in a graphical details view.
Workbooks abstract away the difficult work of creating custom reports and visualizations into an easily consumable format. While some users might only want to adjust the prebuilt parameters, workbooks are customizable.
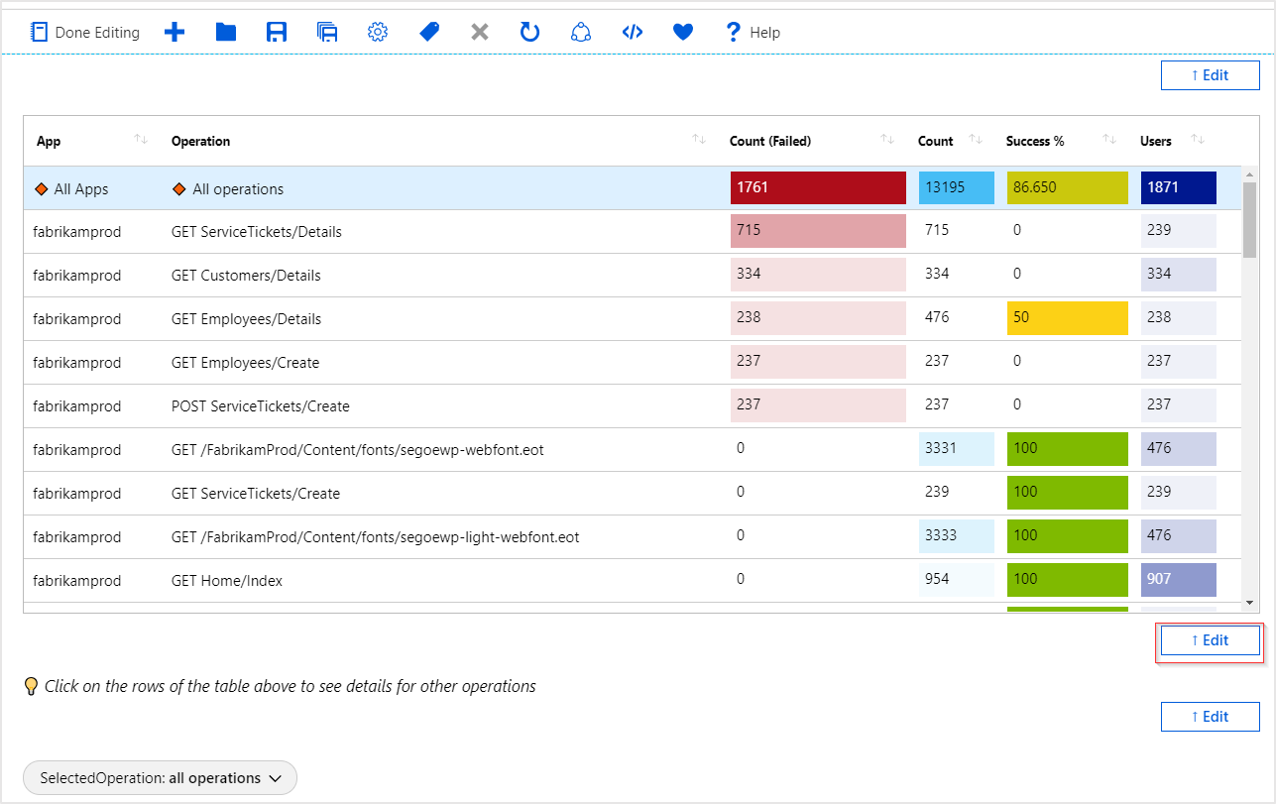
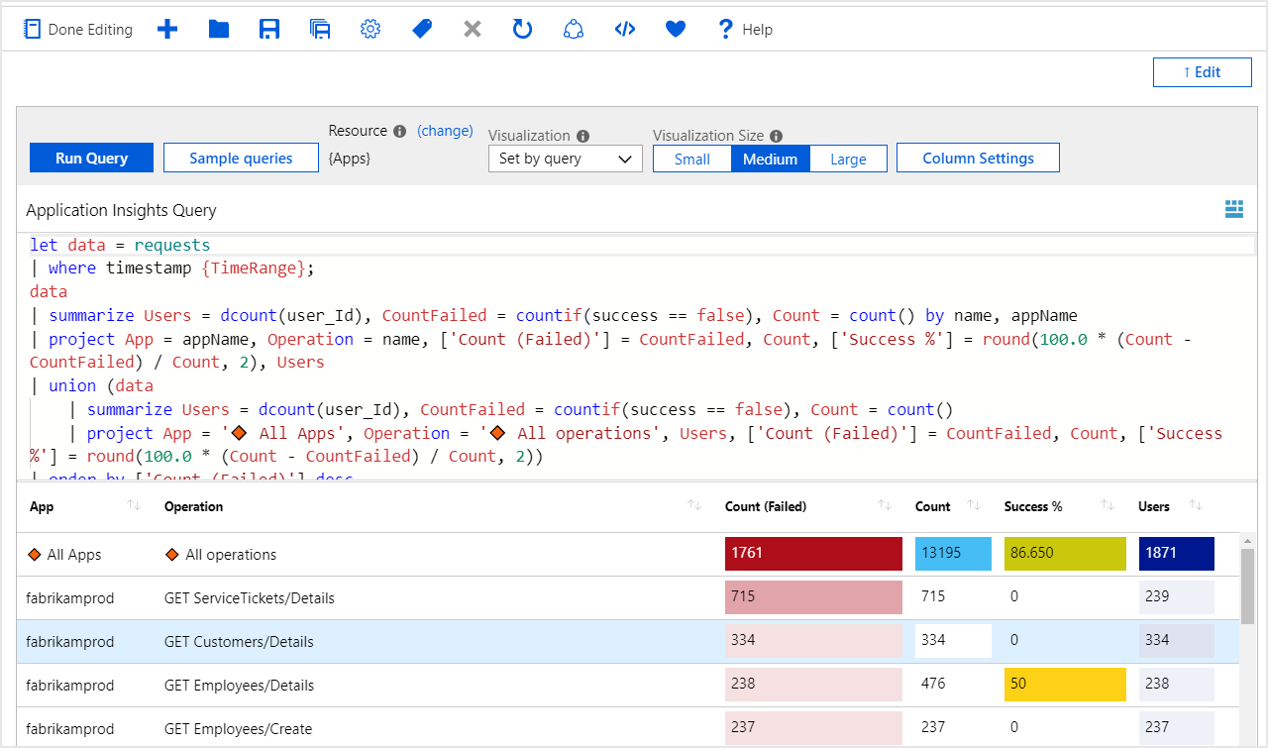
To understand how this workbook functions internally, select Edit in the top bar.
Edit boxes appear near the various elements of the workbook. Select the Edit box located below the table of operations.
This action reveals the underlying log query that drives the table visualization.
You can modify the query directly. Or you can use it as a reference and borrow from it when designing your own custom parameterized workbook.
Investigate performance
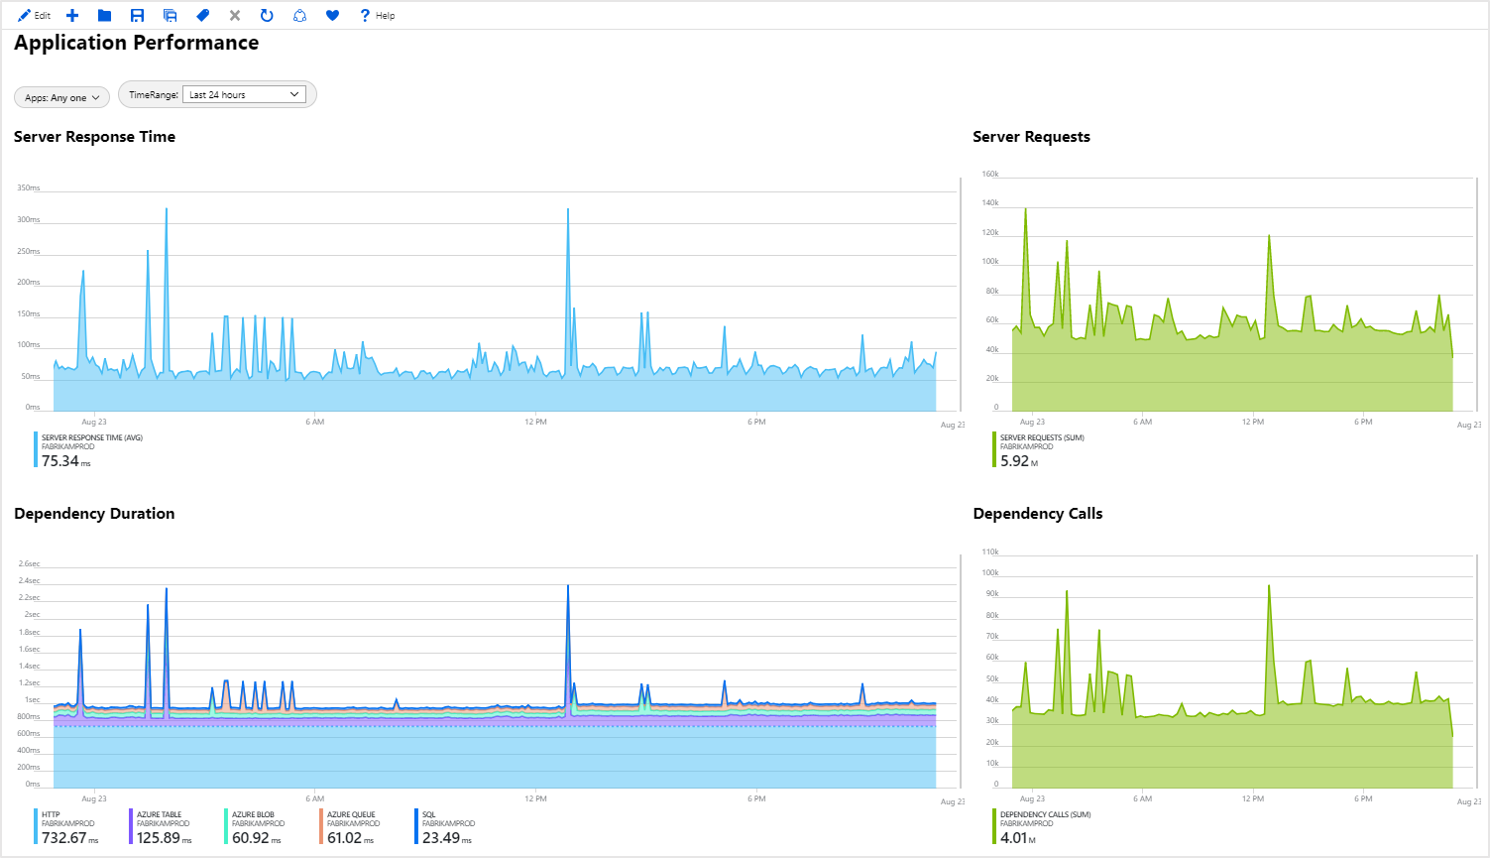
Performance offers its own gallery of workbooks. For App Service, the prebuilt Application Performance workbook offers the following view:
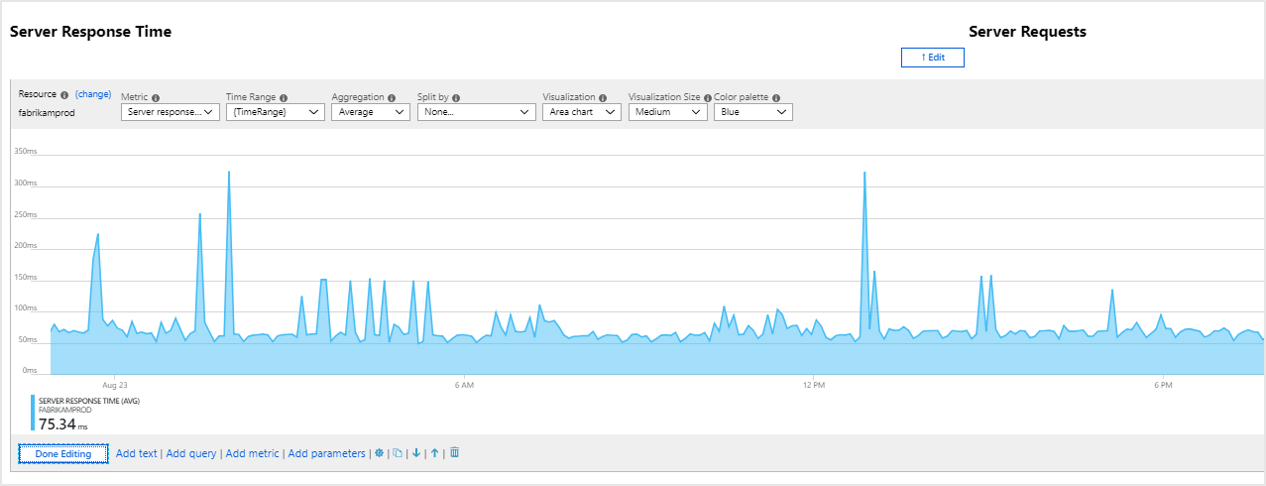
If you select edit, you see that Azure Monitor Metrics powers this set of visualizations.
Troubleshooting
Enabling access to alerts
To see alerts in Resource group insights, someone with the Owner or Contributor role for this subscription needs to open resource group insights for any resource group in the subscription. This action enables anyone with read access to see alerts in resource group insights for all of the resource groups in the subscription. If you have an Owner or Contributor role, refresh this page in a few minutes.
Resource group insights rely on the Azure Monitor Alerts Management system to retrieve alert status. By default, Alerts Management isn't configured for every resource group and subscription. Only someone with the Owner or Contributor role can enable it. They can enable it by:
- Opening Resource Group insights for any resource group in the subscription.
- Or by going to the subscription, clicking Resource Providers, then clicking Register for Microsoft.AlertsManagement.
