Note
Access to this page requires authorization. You can try signing in or changing directories.
Access to this page requires authorization. You can try changing directories.
Java Virtual Machine (JVM) metrics are critical for monitoring the health and performance of your Java applications. The data collected includes insights into memory usage, garbage collection, thread count of your JVM. Use the following metrics to help ensure the health and stability of your applications.
Collected metrics
| Category | Title | Description | Metric ID | Unit |
|---|---|---|---|---|
| Java | jvm.memory.total.used |
Total amount of memory used by heap or nonheap | JvmMemoryTotalUsed |
bytes |
| Java | jvm.memory.total.committed |
Total amount of memory guaranteed to be available for heap or nonheap | JvmMemoryTotalCommitted |
bytes |
| Java | jvm.memory.total.limit |
Total amount of maximum obtainable memory for heap or nonheap | JvmMemoryTotalLimit |
bytes |
| Java | jvm.memory.used |
Amount of memory used by each pool | JvmMemoryUsed |
bytes |
| Java | jvm.memory.committed |
Amount of memory guaranteed to be available for each pool | JvmMemoryCommitted |
bytes |
| Java | jvm.memory.limit |
Amount of maximum obtainable memory for each pool | JvmMemoryLimit |
bytes |
| Java | jvm.buffer.memory.usage |
Amount of memory used by buffers, such as direct memory | JvmBufferMemoryUsage |
bytes |
| Java | jvm.buffer.memory.limit |
Amount of total memory capacity of buffers | JvmBufferMemoryLimit |
bytes |
| Java | jvm.buffer.count |
Number of buffers in the memory pool | JvmBufferCount |
n/a |
| Java | jvm.gc.count |
Count of JVM garbage collection actions | JvmGcCount |
n/a |
| Java | jvm.gc.duration |
Duration of JVM garbage collection actions | JvmGcDuration |
milliseconds |
| Java | jvm.thread.count |
Number of executing platform threads | JvmThreadCount |
n/a |
Configuration
To make the collection of Java metrics available to your app, configure your container app with some specific settings.
In the Create window under the Basics tab, if you select for Deployment source the Container image option, then you have access to stack-specific features.
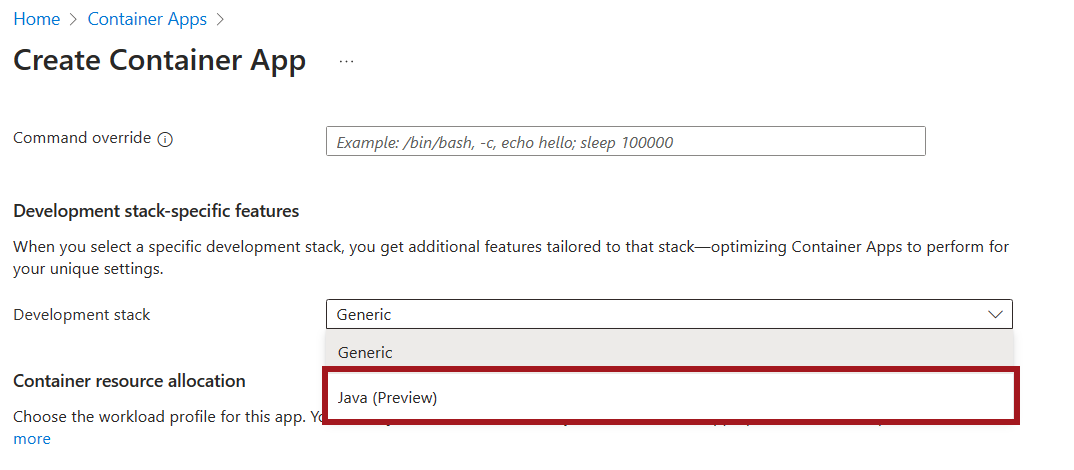
In the Container tab, under the Development stack-specific features, set Development stack to Java.
Once you select the Java development stack, the Customize Java features for your app option appears. Select Customize Java features for your app, and then under Java features, enable JVM core metrics.
There are two CLI options related to the app runtime and Java metrics:
| Option | Description |
|---|---|
--runtime |
The runtime of the container app. Supported values are generic and java. |
--enable-java-metrics |
A boolean option that enables or disables Java metrics for the app. Only applicable for Java runtime. |
Note
The --enable-java-metrics=<true|false> parameter implicitly sets --runtime=java. The --runtime=generic parameter resets all java runtime info.
Enable Java metrics
You can enable Java metrics either via the create or update commands.
View Java Metrics
Use the following steps to view metrics visualizations for your container app.
Go to the Azure portal.
Go to your container app.
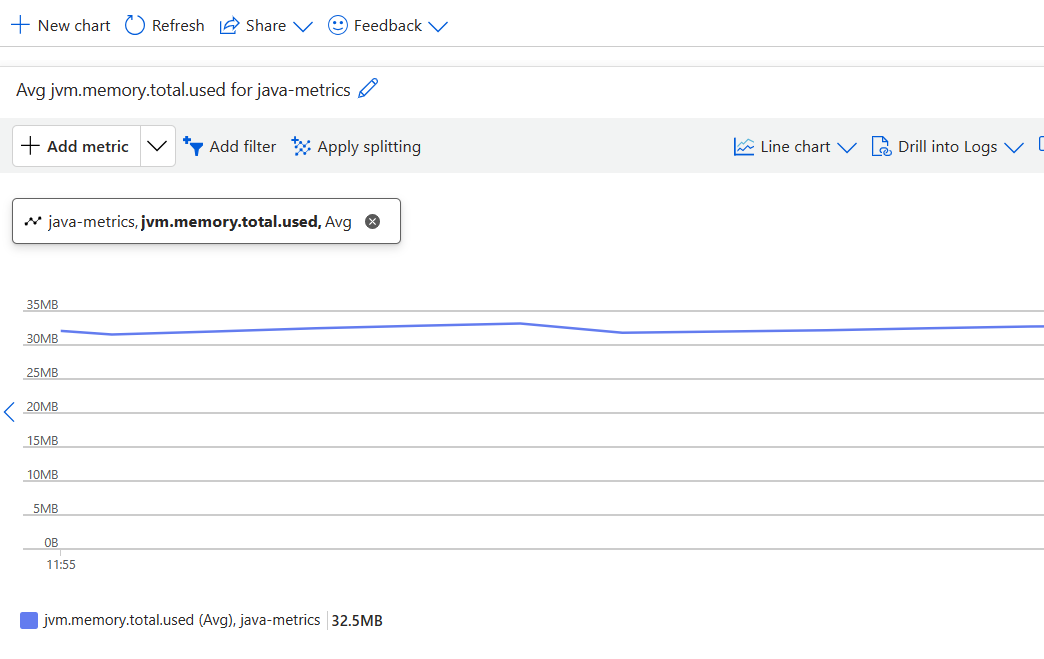
Under the Monitoring section, select Metrics.
From there, you're presented with a chart that plots the metrics you're tracking in your application.
You can see Java metric names on Azure Monitor, but the data sets show as empty unless the feature is enabled. Refer to the Configuration section for how to enable it.

