Note
Access to this page requires authorization. You can try signing in or changing directories.
Access to this page requires authorization. You can try changing directories.
Switch services using the Version drop-down list. Learn more about navigation.
Applies to: ✅ Azure Data Explorer
This document describes the resource consumption information returned as part of a Kusto query response.
When executing a query, the service returns not only the query results but also detailed information about the resources consumed during query execution.
Understanding query resource consumption data helps in optimizing query performance, identifying bottlenecks, and planning for appropriate resource allocation. By monitoring these metrics over time, you can make informed decisions about query design, cluster configuration, and data organization to ensure optimal performance and cost-efficiency of your Kusto queries.
The resource consumption data is returned in the QueryResourceConsumption object as part of the query response, typically in JSON format. You can find the object in Monitoring tools or by Programmatic access.
Structure of the QueryResourceConsumption object
The QueryResourceConsumption object typically includes the following main sections:
QueryHash: A unique identifier for the query structure. This hash represents the query without its literal values, allowing for identification of similar query patterns even when the specific literal values differ. For example, queries likeEvents | where Timestamp > datetime(2023-01-01)andEvents | where Timestamp > datetime(2023-02-01)would have the same QueryHash, as they share the same structure, only differing in the literal datetime values.ExecutionTime: Total execution time in secondsresource_usage: Detailed breakdown of resources usedinput_dataset_statistics: Statistics about the data inputs processeddataset_statistics: Statistics about the resulting datasetcross_cluster_resource_usage: Information about resources used across clusters where relevant
Resource usage details
The resource usage section provides detailed information about the resources consumed during query execution. It includes the following subsections:
resource_usage.cache.shards: Information about cache usageresource_usage.cpu: Information about CPU usageresource_usage.memory: Information about memory usageresource_usage.network: Information about network usageinput_dataset_statistics: Information about the input dataset
Cache usage
The resource_usage.cache.shards section provides information about how the query utilized the cache:
| Object | Property | Description |
|---|---|---|
hot |
Data served from the hot cache | |
hitbytes |
Amount of data successfully retrieved from hot cache in bytes | |
missbytes |
Amount of data not found in hot cache in bytes | |
retrievebytes |
Amount of data retrieved from storage to satisfy misses in bytes | |
cold |
Data served from the cold cache | |
hitbytes |
Amount of data successfully retrieved from cold cache in bytes | |
missbytes |
Amount of data in bytes not found in cold cache in bytes | |
retrievebytes |
Amount of data retrieved from storage to satisfy misses in bytes | |
bypassbytes |
Amount of data that bypassed the cache in bytes | |
results_cache_origin |
Information about the original query whose results were cached and reused | |
client_request_id |
Unique identifier of the original request that populated the cache | |
started_on |
Timestamp when the original query that populated the cache was executed | |
partial_query_results |
Statistics of per-shard level caching, if enabled | |
hits |
Number of shard-level query results found in the cache | |
misses |
Number of shard-level query results missing from the cache |
CPU usage
The resource_usage.cpu section provides information about CPU consumption:
| Object | Property | Description |
|---|---|---|
user |
User-mode CPU time | |
kernel |
Kernel-mode CPU time | |
total cpu |
Total CPU time consumed | |
breakdown |
Further breakdown of CPU usage | |
query execution |
CPU time for query execution | |
query planning |
CPU time for query planning |
Memory usage
The resource_usage.memory section provides information about memory consumption:
| Object | Property | Description |
|---|---|---|
peak_per_node |
Peak memory usage per node in bytes |
Network usage
The resource_usage.network section provides information about network usage:
| Object | Property | Description |
|---|---|---|
inter_cluster_total_bytes |
Total bytes transferred within the cluster | |
cross_cluster_total_bytes |
Total bytes transferred across clusters |
Input dataset statistics
The input_dataset_statistics section provides details about the source data processed:
| Object | Property | Description |
|---|---|---|
extents |
Information about data extents | |
total |
Total number of extents in all tables referenced by the query | |
scanned |
Number of extents scanned (examined by query nodes) | |
scanned_min_datetime |
Minimum datetime of scanned data | |
scanned_max_datetime |
Maximum datetime of scanned data | |
rows |
Information about data rows | |
total |
Total number of rows in all tables referenced by the query | |
scanned |
Number of rows scanned (examined by query nodes) | |
rowstores |
Information about rowstore data | |
scanned_rows |
Number of rows scanned from rowstores | |
scanned_values_size |
Size of values scanned from rowstores | |
shards |
Information about shard queries | |
total |
Total number of shards in all tables referenced by the query | |
scanned |
Number of shards scanned (examined by query nodes) | |
external_data |
Information about external data (if applicable) | |
downloaded_items |
Number of items downloaded from external data sources | |
downloaded_bytes |
Number of bytes downloaded from external data sources | |
iterated_artifacts |
Number of artifacts iterated from external data sources |
Integration with monitoring tools
The QueryResourceConsumption data can be collected and analyzed over time to identify trends and anomalies in query performance. This data is available through:
- Query execution results
.show queriescommand output- Diagnostic logs exported to monitoring solutions
Monitoring this data can help identify query optimization opportunities and track the impact of changes to your data models or query patterns.
Query execution results
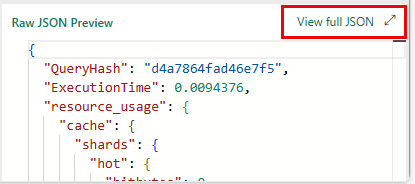
You can access the raw JSON file of QueryResourceConsumption data directly from the query execution results. The information is displayed in the results grid located below the query editor.
Run a query in the query pane.
Browse to the Stats tab of the query results.

View the Raw JSAN Preview section and select the View full JSON option to scroll through the raw JSON.
Programmatic access
In client applications, you can access the QueryResourceConsumption information programmatically:
// Example of accessing QueryResourceConsumption in C#
var dataSet = kustoClient.ExecuteQuery(query);
var resourceConsumption = GetQueryResourceConsumption(dataSet.Tables[2], false);
Console.WriteLine($"Execution time: {resourceConsumption.ExecutionTime}");
Console.WriteLine($"Memory peak: {resourceConsumption.ResourceUsage.Memory.PeakPerNode}");
For more information, see Create an app to run management commands.
Examples
Data in Hot Cache: This example shows a query that was served entirely from the hot cache (hitbytes: 517324, missbytes: 0) and had minimal execution time (0.0045931 seconds). All data was found in the hot cache, resulting in very fast query execution.
{
  "QueryHash": "add172cd28dde0eb",
  "ExecutionTime": 0.0045931,
  "resource_usage": {
    "cache": {
      "shards": {
        "hot": {
          "hitbytes": 517324,
          "missbytes": 0,
          "retrievebytes": 0
        },
        "cold": {
          "hitbytes": 0,
          "missbytes": 0,
          "retrievebytes": 0
        },
        "bypassbytes": 0
      }
    },
    "cpu": {
      "user": "00:00:00",
      "kernel": "00:00:00",
      "total cpu": "00:00:00",
      "breakdown": {
        "query execution": "00:00:00",
        "query planning": "00:00:00"
      }
    },
    "memory": {
      "peak_per_node": 1580848
    },
    "network": {
      "inter_cluster_total_bytes": 27384,
      "cross_cluster_total_bytes": 0
    }
  },
  "input_dataset_statistics": {
    "extents": {
      "total": 1,
      "scanned": 1,
      "scanned_min_datetime": "2016-03-17T08:24:02.6259906Z",
      "scanned_max_datetime": "2016-03-17T08:24:02.6259906Z"
    },
    "rows": {
      "total": 59066,
      "scanned": 59066
    },
    "rowstores": {
      "scanned_rows": 0,
      "scanned_values_size": 0
    },
    "shards": {
      "queries_generic": 1,
      "queries_specialized": 0
    }
  },
  "dataset_statistics": [
    {
      "table_row_count": 10,
      "table_size": 11473
    }
  ],
  "cross_cluster_resource_usage": {}
}
Data from External Tables: This example shows a query that processed external data. Note the high execution time (159.88 seconds) and significant CPU utilization (over 1 hour total CPU time). The external data section shows that 6,709 items were downloaded, totaling approximately 87.7 GB. This is typical for queries that need to fetch large amounts of data from external sources, which is significantly slower than querying data in Kusto's internal storage.
{
  "QueryHash": "529656ef4099485b",
  "ExecutionTime": 159.8833962,
  "resource_usage": {
    "cache": {
      "shards": {
        "hot": {
          "hitbytes": 0,
          "missbytes": 0,
          "retrievebytes": 0
        },
        "cold": {
          "hitbytes": 0,
          "missbytes": 0,
          "retrievebytes": 0
        },
        "bypassbytes": 0
      }
    },
    "cpu": {
      "user": "01:01:13.5312500",
      "kernel": "00:00:44.9687500",
      "total cpu": "01:01:58.5000000",
      "breakdown": {
        "query execution": "01:01:58.5000000",
        "query planning": "00:00:00"
      }
    },
    "memory": {
      "peak_per_node": 26834528
    },
    "network": {
      "inter_cluster_total_bytes": 6745,
      "cross_cluster_total_bytes": 0
    }
  },
  "input_dataset_statistics": {
    "extents": {
      "total": 0,
      "scanned": 0,
      "scanned_min_datetime": "0001-01-01T00:00:00.0000000Z",
      "scanned_max_datetime": "0001-01-01T00:00:00.0000000Z"
    },
    "rows": {
      "total": 0,
      "scanned": 0
    },
    "rowstores": {
      "scanned_rows": 0,
      "scanned_values_size": 0
    },
    "shards": {
      "queries_generic": 0,
      "queries_specialized": 0
    },
    "external_data": {
      "downloaded_items": 6709,
      "downloaded_bytes": 87786879356,
      "iterated_artifacts": 6709
    }
  },
  "dataset_statistics": [
    {
      "table_row_count": 2,
      "table_size": 44
    }
  ],
  "cross_cluster_resource_usage": {}
}
Data from Cold Cache: This example shows a query that retrieved data from the cold cache (cold.hitbytes: 127209). Note that out of 1,250 total extents, only 1 was scanned, and out of 50,000 total rows, only 40 were scanned. This suggests an efficient query that uses appropriate filtering. Cold cache access is typically slower than hot cache but faster than retrieving data directly from storage.
{
  "QueryHash": "480873c9b515cea8",
  "ExecutionTime": 1.4233768,
  "resource_usage": {
    "cache": {
      "shards": {
        "hot": {
          "hitbytes": 0,
          "missbytes": 0,
          "retrievebytes": 0
        },
        "cold": {
          "hitbytes": 127209,
          "missbytes": 0,
          "retrievebytes": 0
        },
        "bypassbytes": 0
      }
    },
    "cpu": {
      "user": "00:00:00",
      "kernel": "00:00:00",
      "total cpu": "00:00:00",
      "breakdown": {
        "query execution": "00:00:00",
        "query planning": "00:00:00"
      }
    },
    "memory": {
      "peak_per_node": 2098656
    },
    "network": {
      "inter_cluster_total_bytes": 250676,
      "cross_cluster_total_bytes": 0
    }
  },
  "input_dataset_statistics": {
    "extents": {
      "total": 1250,
      "scanned": 1,
      "scanned_min_datetime": "2024-01-08T07:13:13.6172552Z",
      "scanned_max_datetime": "2024-01-08T07:13:13.6172552Z"
    },
    "rows": {
      "total": 50000,
      "scanned": 40
    },
    "rowstores": {
      "scanned_rows": 0,
      "scanned_values_size": 0
    },
    "shards": {
      "queries_generic": 1,
      "queries_specialized": 0
    }
  },
  "dataset_statistics": [
    {
      "table_row_count": 10,
      "table_size": 123654
    }
  ],
  "cross_cluster_resource_usage": {}
}
Results from Query Cache: This example demonstrates a query served from the query results cache. Note the presence of the results_cache_origin section, which indicates the results were retrieved from a previously cached query result. The extremely fast execution time (0.0039999 seconds) shows the benefit of query results caching, as no data processing was needed. The cache contains information about the original request that populated the cache (client_request_id) and when it was initially executed (started_on). Notice that no data was scanned from extents or rows as indicated by zeros in the input_dataset_statistics section, confirming that the results were retrieved directly from the query cache.
{
  "ExecutionTime": 0.0039999,
  "resource_usage": {
    "cache": {
      "shards": {
        "hot": {
          "hitbytes": 0,
          "missbytes": 0,
          "retrievebytes": 0
        },
        "cold": {
          "hitbytes": 0,
          "missbytes": 0,
          "retrievebytes": 0
        },
        "bypassbytes": 0
      },
      "results_cache_origin": {
        "client_request_id": "KE.DF.RunQuery;95b6d241-e684-4a43-91c8-da0d6a854e3e",
        "started_on": "2025-04-22T08:22:24.4719143Z"
      }
    },
    "cpu": {
      "user": "00:00:00.0156250",
      "kernel": "00:00:00",
      "total cpu": "00:00:00.0156250",
      "breakdown": {
        "query execution": "00:00:00.0156250",
        "query planning": "00:00:00"
      }
    },
    "memory": {
      "peak_per_node": 53440160
    },
    "network": {
      "inter_cluster_total_bytes": 13233,
      "cross_cluster_total_bytes": 0
    }
  },
  "input_dataset_statistics": {
    "extents": {
      "total": 0,
      "scanned": 0,
      "scanned_min_datetime": "0001-01-01T00:00:00.0000000Z",
      "scanned_max_datetime": "0001-01-01T00:00:00.0000000Z"
    },
    "rows": {
      "total": 0,
      "scanned": 0
    },
    "rowstores": {
      "scanned_rows": 0,
      "scanned_values_size": 0
    },
    "shards": {
      "queries_generic": 0,
      "queries_specialized": 0
    }
  },
  "dataset_statistics": [
    {
      "table_row_count": 10,
      "table_size": 12121
    }
  ],
  "cross_cluster_resource_usage": {}
}
Results from Partial Query Cache (Per-Shard): This example illustrates a query that benefited from per-shard level caching, as indicated by the partial_query_results section. The cache shows 1 hit and 0 misses, meaning the query was able to retrieve pre-computed results for the shard without having to reprocess the data. Unlike the full query cache example, the input_dataset_statistics shows that data was technically "scanned" (59,066 rows), but this was likely just a metadata operation since the actual computation was retrieved from cache. Note the very fast execution time (0.0047499 seconds), demonstrating the performance advantage of partial query caching. Per-shard caching is particularly useful for queries that repeatedly access the same data partitions with the same filtering conditions.
{
  "QueryHash": "da3c6dc30e7b203d",
  "ExecutionTime": 0.0047499,
  "resource_usage": {
    "cache": {
      "shards": {
        "hot": {
          "hitbytes": 0,
          "missbytes": 0,
          "retrievebytes": 0
        },
        "cold": {
          "hitbytes": 0,
          "missbytes": 0,
          "retrievebytes": 0
        },
        "bypassbytes": 0
      },
      "partial_query_results": {
        "hits": 1,
        "misses": 0
      }
    },
    "cpu": {
      "user": "00:00:00.0156250",
      "kernel": "00:00:00",
      "total cpu": "00:00:00.0156250",
      "breakdown": {
        "query execution": "00:00:00.0156250",
        "query planning": "00:00:00"
      }
    },
    "memory": {
      "peak_per_node": 1580848
    },
    "network": {
      "inter_cluster_total_bytes": 27428,
      "cross_cluster_total_bytes": 0
    }
  },
  "input_dataset_statistics": {
    "extents": {
      "total": 1,
      "scanned": 1,
      "scanned_min_datetime": "2016-03-17T08:24:02.6259906Z",
      "scanned_max_datetime": "2016-03-17T08:24:02.6259906Z"
    },
    "rows": {
      "total": 59066,
      "scanned": 59066
    },
    "rowstores": {
      "scanned_rows": 0,
      "scanned_values_size": 0
    },
    "shards": {
      "queries_generic": 0,
      "queries_specialized": 0
    }
  },
  "dataset_statistics": [
    {
      "table_row_count": 10,
      "table_size": 11473
    }
  ],
  "cross_cluster_resource_usage": {}
}