Note
Access to this page requires authorization. You can try signing in or changing directories.
Access to this page requires authorization. You can try changing directories.
Applies to: ✅ Azure Data Explorer ✅ Azure Monitor ✅ Microsoft Sentinel
The function plotly_anomaly_fl() is a user-defined function (UDF) that allows you to customize a plotly template to create an interactive anomaly chart.
The function accepts a table containing the source and the baseline time series, lists of positive and negative anomalies with their respective sizes, and chart labeling string. The function returns a single cell table containing plotly JSON. Optionally, you can render the data in an Azure Data Explorer dashboard tile. For more information, see Plotly (preview).
Note
Consider using Azure Data Explorer native " | render anomalychart" method for rendering a non-interactive anomaly chart.
Prerequisite
Extract the required 'anomaly' template from the publicly available PlotlyTemplate table. Copy this table from the Samples database to your database by running the following KQL command from your target database:
.set PlotlyTemplate <| cluster('help.chinaeast2.kusto.chinacloudapi.cn').database('Samples').PlotlyTemplate
Syntax
T | invoke plotly_anomaly_fl(time_col, val_col, baseline_col, time_high_col, val_high_col, size_high_col, time_low_col, val_low__col, size_low_col, chart_title, series_name, val_name)
Learn more about syntax conventions.
Parameters
| Name | Type | Required | Description |
|---|---|---|---|
| time_col | string |
✔️ | The name of the column containing the dynamic array of the time points of the original time series |
| val_col | string |
✔️ | The name of the column containing the values of the original time series |
| baseline_col | string |
✔️ | The name of the column containing the values of the baseline time series. Anomalies are usually detected by large value offset from the expected baseline value. |
| time_high_col | string |
✔️ | The name of the column containing the time points of high (above the baseline) anomalies |
| val_high_col | string |
✔️ | The name of the column containing the values of the high anomalies |
| size_high_col | string |
✔️ | The name of the column containing the marker sizes of the high anomalies |
| time_low_col | string |
✔️ | The name of the column containing the time points of low anomalies |
| val_low_col | string |
✔️ | The name of the column containing the values of the low anomalies |
| size_low_col | string |
✔️ | The name of the column containing the marker sizes of the low anomalies |
| chart_title | string |
Chart title, default is 'Anomaly Chart' | |
| series_name | string |
Time series name, default is 'Metric' | |
| val_name | string |
Value axis name, default is 'Value' |
Function definition
You can define the function by either embedding its code as a query-defined function, or creating it as a stored function in your database, as follows:
Define the function using the following let statement. No permissions are required.
Important
A let statement can't run on its own. It must be followed by a tabular expression statement. To run a working example of plotly_anomaly_fl(), see Example.
let plotly_anomaly_fl=(tbl:(*), time_col:string, val_col:string, baseline_col:string, time_high_col:string , val_high_col:string, size_high_col:string,
                                time_low_col:string, val_low_col:string, size_low_col:string,
                                chart_title:string='Anomaly chart', series_name:string='Metric', val_name:string='Value')
{
    let anomaly_chart = toscalar(PlotlyTemplate | where name == "anomaly" | project plotly);
    let tbl_ex = tbl | extend _timestamp = column_ifexists(time_col, datetime(null)), _values = column_ifexists(val_col, 0.0), _baseline = column_ifexists(baseline_col, 0.0),
                              _high_timestamp = column_ifexists(time_high_col, datetime(null)), _high_values = column_ifexists(val_high_col, 0.0), _high_size = column_ifexists(size_high_col, 1),
                              _low_timestamp = column_ifexists(time_low_col, datetime(null)), _low_values = column_ifexists(val_low_col, 0.0), _low_size = column_ifexists(size_low_col, 1);
    tbl_ex
    | extend plotly = anomaly_chart
    | extend plotly=replace_string(plotly, '$TIME_STAMPS$', tostring(_timestamp))
    | extend plotly=replace_string(plotly, '$SERIES_VALS$', tostring(_values))
    | extend plotly=replace_string(plotly, '$BASELINE_VALS$', tostring(_baseline))
    | extend plotly=replace_string(plotly, '$TIME_STAMPS_HIGH_ANOMALIES$', tostring(_high_timestamp))
    | extend plotly=replace_string(plotly, '$HIGH_ANOMALIES_VALS$', tostring(_high_values))
    | extend plotly=replace_string(plotly, '$HIGH_ANOMALIES_MARKER_SIZE$', tostring(_high_size))
    | extend plotly=replace_string(plotly, '$TIME_STAMPS_LOW_ANOMALIES$', tostring(_low_timestamp))
    | extend plotly=replace_string(plotly, '$LOW_ANOMALIES_VALS$', tostring(_low_values))
    | extend plotly=replace_string(plotly, '$LOW_ANOMALIES_MARKER_SIZE$', tostring(_low_size))
    | extend plotly=replace_string(plotly, '$TITLE$', chart_title)
    | extend plotly=replace_string(plotly, '$SERIES_NAME$', series_name)
    | extend plotly=replace_string(plotly, '$Y_NAME$', val_name)
    | project plotly
};
// Write your query to use the function here.
Example
The following example uses the invoke operator to run the function.
To use a query-defined function, invoke it after the embedded function definition.
let plotly_anomaly_fl=(tbl:(*), time_col:string, val_col:string, baseline_col:string, time_high_col:string , val_high_col:string, size_high_col:string,
                                time_low_col:string, val_low_col:string, size_low_col:string,
                                chart_title:string='Anomaly chart', series_name:string='Metric', val_name:string='Value')
{
    let anomaly_chart = toscalar(PlotlyTemplate | where name == "anomaly" | project plotly);
    let tbl_ex = tbl | extend _timestamp = column_ifexists(time_col, datetime(null)), _values = column_ifexists(val_col, 0.0), _baseline = column_ifexists(baseline_col, 0.0),
                              _high_timestamp = column_ifexists(time_high_col, datetime(null)), _high_values = column_ifexists(val_high_col, 0.0), _high_size = column_ifexists(size_high_col, 1),
                              _low_timestamp = column_ifexists(time_low_col, datetime(null)), _low_values = column_ifexists(val_low_col, 0.0), _low_size = column_ifexists(size_low_col, 1);
    tbl_ex
    | extend plotly = anomaly_chart
    | extend plotly=replace_string(plotly, '$TIME_STAMPS$', tostring(_timestamp))
    | extend plotly=replace_string(plotly, '$SERIES_VALS$', tostring(_values))
    | extend plotly=replace_string(plotly, '$BASELINE_VALS$', tostring(_baseline))
    | extend plotly=replace_string(plotly, '$TIME_STAMPS_HIGH_ANOMALIES$', tostring(_high_timestamp))
    | extend plotly=replace_string(plotly, '$HIGH_ANOMALIES_VALS$', tostring(_high_values))
    | extend plotly=replace_string(plotly, '$HIGH_ANOMALIES_MARKER_SIZE$', tostring(_high_size))
    | extend plotly=replace_string(plotly, '$TIME_STAMPS_LOW_ANOMALIES$', tostring(_low_timestamp))
    | extend plotly=replace_string(plotly, '$LOW_ANOMALIES_VALS$', tostring(_low_values))
    | extend plotly=replace_string(plotly, '$LOW_ANOMALIES_MARKER_SIZE$', tostring(_low_size))
    | extend plotly=replace_string(plotly, '$TITLE$', chart_title)
    | extend plotly=replace_string(plotly, '$SERIES_NAME$', series_name)
    | extend plotly=replace_string(plotly, '$Y_NAME$', val_name)
    | project plotly
};
let min_t = datetime(2017-01-05);
let max_t = datetime(2017-02-03 22:00);
let dt = 2h;
let marker_scale = 8;
let s_name = 'TS1';
demo_make_series2
| make-series num=avg(num) on TimeStamp from min_t to max_t step dt by sid
| where sid == s_name
| extend (anomalies, score, baseline) = series_decompose_anomalies(num, 1.5, -1, 'linefit')
| mv-apply num1=num to typeof(double), anomalies1=anomalies to typeof(double), score1=score to typeof(double), TimeStamp1=TimeStamp to typeof(datetime)  on (
    summarize pAnomalies=make_list_if(num1, anomalies1 > 0), pTimeStamp=make_list_if(TimeStamp1, anomalies1 > 0), pSize=make_list_if(toint(score1*marker_scale), anomalies1 > 0),
              nAnomalies=make_list_if(num1, anomalies1 < 0), nTimeStamp=make_list_if(TimeStamp1, anomalies1 < 0), nSize=make_list_if(toint(-score1*marker_scale), anomalies1 < 0)
)
| invoke plotly_anomaly_fl('TimeStamp', 'num', 'baseline', 'pTimeStamp', 'pAnomalies', 'pSize', 'nTimeStamp', 'nAnomalies', 'nSize',
                           chart_title='Anomaly chart using plotly_anomaly_fl()', series_name=s_name, val_name='# of requests')
| render plotly
Output
The output is a Plotly JSON string that can be rendered using '| render plotly' or in an Azure Data Explorer dashboard tile. For more information on creating dashboard tiles, see Visualize data with Azure Data Explorer dashboards .
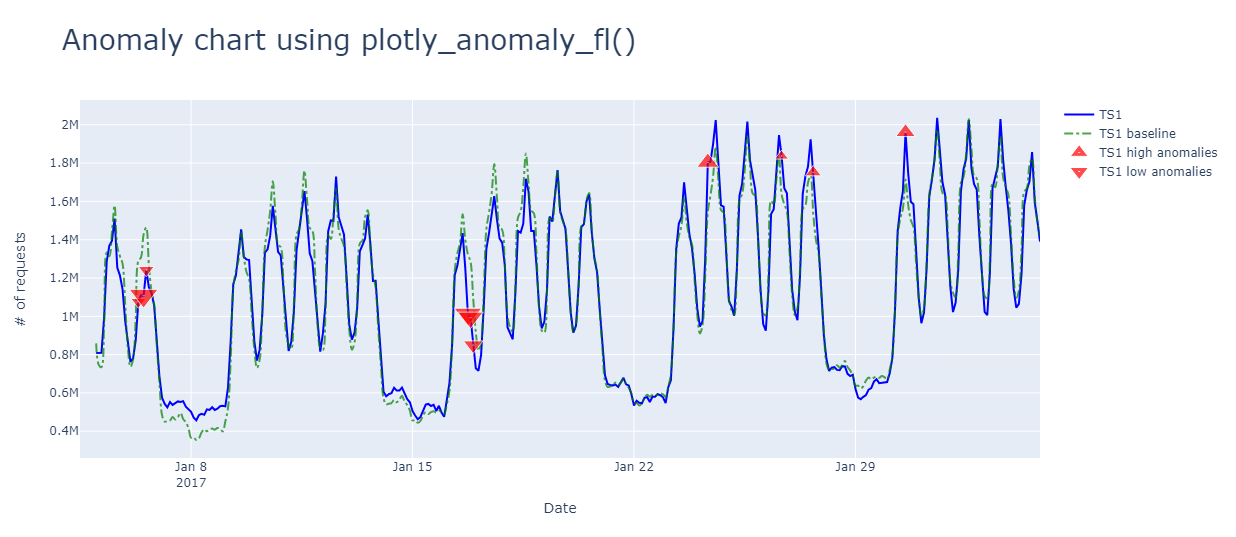
The following image shows a sample anomaly chart using the above function:

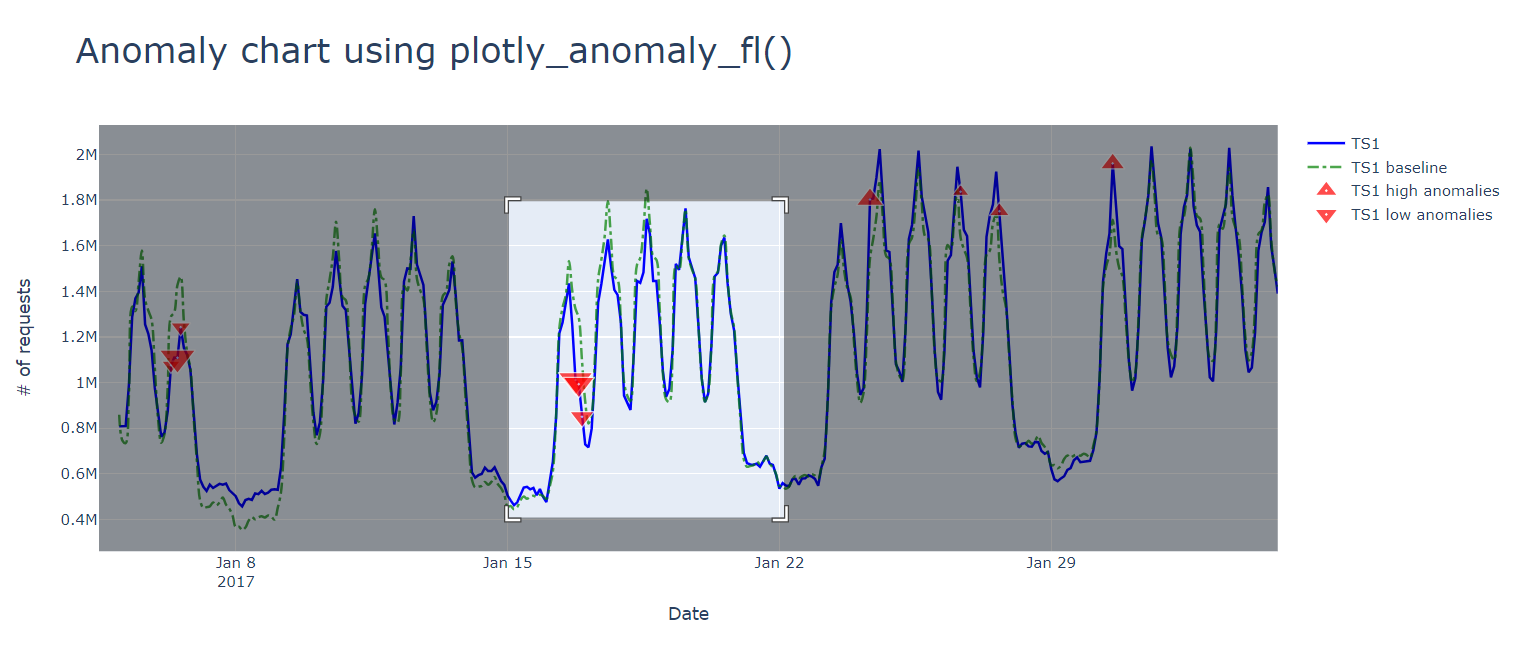
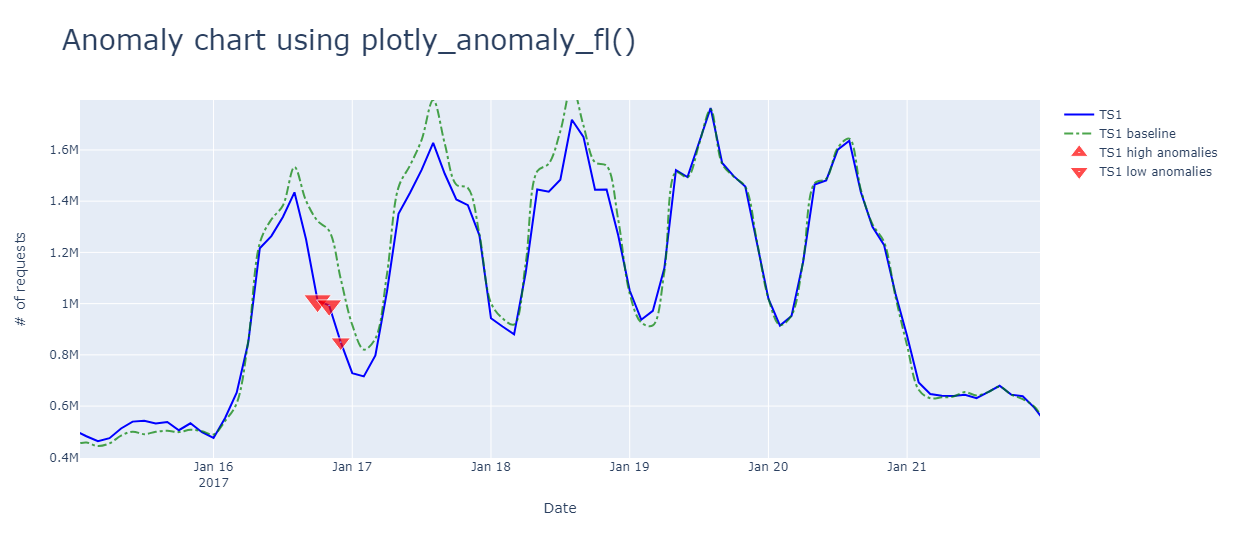
You can zoom in and hover over anomalies:

