Note
Access to this page requires authorization. You can try signing in or changing directories.
Access to this page requires authorization. You can try changing directories.
Switch services using the Version drop-down list. Learn more about navigation.
Applies to: ✅ Azure Data Explorer
The function series_fit_lowess_fl() is a user-defined function (UDF) that applies a LOWESS regression on a series. This function takes a table with multiple series (dynamic numerical arrays) and generates a LOWESS Curve, which is a smoothed version of the original series.
Prerequisites
- The Python plugin must be enabled on the cluster. This is required for the inline Python used in the function.
Syntax
T | invoke series_fit_lowess_fl(y_series, y_fit_series, [ fit_size ], [ x_series ], [ x_istime ])
Learn more about syntax conventions.
Parameters
| Name | Type | Required | Description |
|---|---|---|---|
| y_series | string |
✔️ | The name of the input table column containing the dependent variable. This column is the series to fit. |
| y_fit_series | string |
✔️ | The name of the column to store the fitted series. |
| fit_size | int |
For each point, the local regression is applied on its respective fit_size closest points. The default is 5. | |
| x_series | string |
The name of the column containing the independent variable, that is, the x or time axis. This parameter is optional, and is needed only for unevenly spaced series. The default value is an empty string, as x is redundant for the regression of an evenly spaced series. | |
| x_istime | bool |
This boolean parameter is needed only if x_series is specified and it's a vector of datetime. The default is false. |
Function definition
You can define the function by either embedding its code as a query-defined function, or creating it as a stored function in your database, as follows:
Define the function using the following let statement. No permissions are required.
Important
A let statement can't run on its own. It must be followed by a tabular expression statement. To run a working example of series_fit_lowess_fl(), see Examples.
let series_fit_lowess_fl=(tbl:(*), y_series:string, y_fit_series:string, fit_size:int=5, x_series:string='', x_istime:bool=False)
{
    let kwargs = bag_pack('y_series', y_series, 'y_fit_series', y_fit_series, 'fit_size', fit_size, 'x_series', x_series, 'x_istime', x_istime);
    let code = ```if 1:
        y_series = kargs["y_series"]
        y_fit_series = kargs["y_fit_series"]
        fit_size = kargs["fit_size"]
        x_series = kargs["x_series"]
        x_istime = kargs["x_istime"]
        import statsmodels.api as sm
        def lowess_fit(ts_row, x_col, y_col, fsize):
            y = ts_row[y_col]
            fraction = fsize/len(y)
            if x_col == "": # If there is no x column creates sequential range [1, len(y)]
               x = np.arange(len(y)) + 1
            else: # if x column exists check whether its a time column. If so, normalize it to the [1, len(y)] range, else take it as is.
               if x_istime:
                   x = pd.to_numeric(pd.to_datetime(ts_row[x_col]))
                   x = x - x.min()
                   x = x / x.max()
                   x = x * (len(x) - 1) + 1
               else:
                   x = ts_row[x_col]
            lowess = sm.nonparametric.lowess
            z = lowess(y, x, return_sorted=False, frac=fraction)
            return list(z)
        result = df
        result[y_fit_series] = df.apply(lowess_fit, axis=1, args=(x_series, y_series, fit_size))
    ```;
    tbl
     | evaluate python(typeof(*), code, kwargs)
};
// Write your query to use the function here.
Examples
The following examples use the invoke operator to run the function.
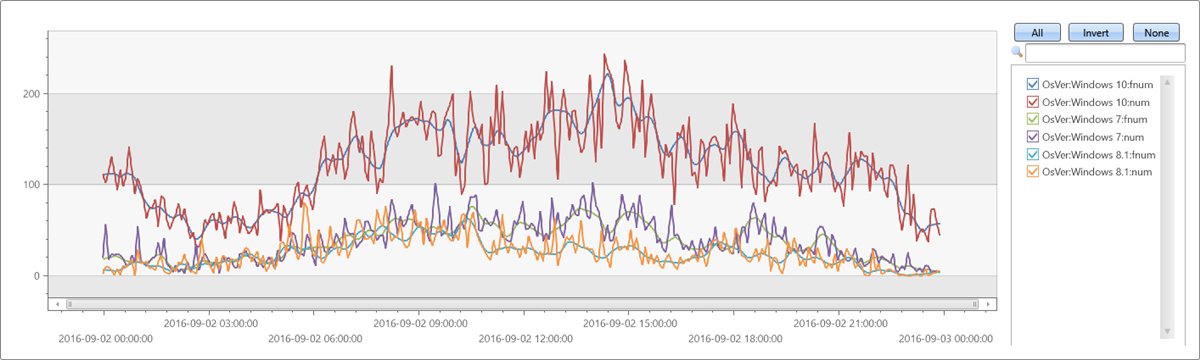
LOWESS regression on regular time series
To use a query-defined function, invoke it after the embedded function definition.
let series_fit_lowess_fl=(tbl:(*), y_series:string, y_fit_series:string, fit_size:int=5, x_series:string='', x_istime:bool=False)
{
    let kwargs = bag_pack('y_series', y_series, 'y_fit_series', y_fit_series, 'fit_size', fit_size, 'x_series', x_series, 'x_istime', x_istime);
    let code = ```if 1:
        y_series = kargs["y_series"]
        y_fit_series = kargs["y_fit_series"]
        fit_size = kargs["fit_size"]
        x_series = kargs["x_series"]
        x_istime = kargs["x_istime"]
        import statsmodels.api as sm
        def lowess_fit(ts_row, x_col, y_col, fsize):
            y = ts_row[y_col]
            fraction = fsize/len(y)
            if x_col == "": # If there is no x column creates sequential range [1, len(y)]
               x = np.arange(len(y)) + 1
            else: # if x column exists check whether its a time column. If so, normalize it to the [1, len(y)] range, else take it as is.
               if x_istime:
                   x = pd.to_numeric(pd.to_datetime(ts_row[x_col]))
                   x = x - x.min()
                   x = x / x.max()
                   x = x * (len(x) - 1) + 1
               else:
                   x = ts_row[x_col]
            lowess = sm.nonparametric.lowess
            z = lowess(y, x, return_sorted=False, frac=fraction)
            return list(z)
        result = df
        result[y_fit_series] = df.apply(lowess_fit, axis=1, args=(x_series, y_series, fit_size))
    ```;
    tbl
     | evaluate python(typeof(*), code, kwargs)
};
//
// Apply 9 points LOWESS regression on regular time series
//
let max_t = datetime(2016-09-03);
demo_make_series1
| make-series num=count() on TimeStamp from max_t-1d to max_t step 5m by OsVer
| extend fnum = dynamic(null)
| invoke series_fit_lowess_fl('num', 'fnum', 9)
| render timechart
Output
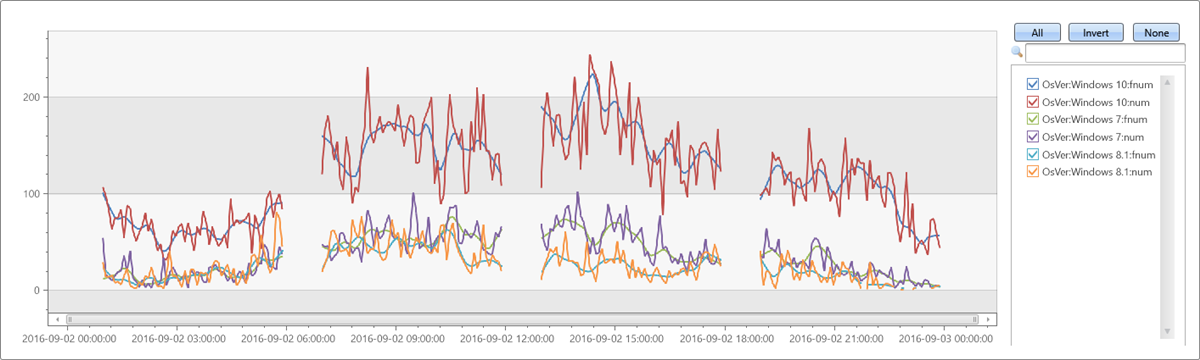
Test irregular time series
To use a query-defined function, invoke it after the embedded function definition.
let series_fit_lowess_fl=(tbl:(*), y_series:string, y_fit_series:string, fit_size:int=5, x_series:string='', x_istime:bool=False)
{
    let kwargs = bag_pack('y_series', y_series, 'y_fit_series', y_fit_series, 'fit_size', fit_size, 'x_series', x_series, 'x_istime', x_istime);
    let code = ```if 1:
        y_series = kargs["y_series"]
        y_fit_series = kargs["y_fit_series"]
        fit_size = kargs["fit_size"]
        x_series = kargs["x_series"]
        x_istime = kargs["x_istime"]
        import statsmodels.api as sm
        def lowess_fit(ts_row, x_col, y_col, fsize):
            y = ts_row[y_col]
            fraction = fsize/len(y)
            if x_col == "": # If there is no x column creates sequential range [1, len(y)]
               x = np.arange(len(y)) + 1
            else: # if x column exists check whether its a time column. If so, normalize it to the [1, len(y)] range, else take it as is.
               if x_istime:
                   x = pd.to_numeric(pd.to_datetime(ts_row[x_col]))
                   x = x - x.min()
                   x = x / x.max()
                   x = x * (len(x) - 1) + 1
               else:
                   x = ts_row[x_col]
            lowess = sm.nonparametric.lowess
            z = lowess(y, x, return_sorted=False, frac=fraction)
            return list(z)
        result = df
        result[y_fit_series] = df.apply(lowess_fit, axis=1, args=(x_series, y_series, fit_size))
    ```;
    tbl
     | evaluate python(typeof(*), code, kwargs)
};
let max_t = datetime(2016-09-03);
demo_make_series1
| where TimeStamp between ((max_t-1d)..max_t)
| summarize num=count() by bin(TimeStamp, 5m), OsVer
| order by TimeStamp asc
| where hourofday(TimeStamp) % 6 != 0   //  delete every 6th hour to create irregular time series
| summarize TimeStamp=make_list(TimeStamp), num=make_list(num) by OsVer
| extend fnum = dynamic(null)
| invoke series_fit_lowess_fl('num', 'fnum', 9, 'TimeStamp', True)
| render timechart
Output
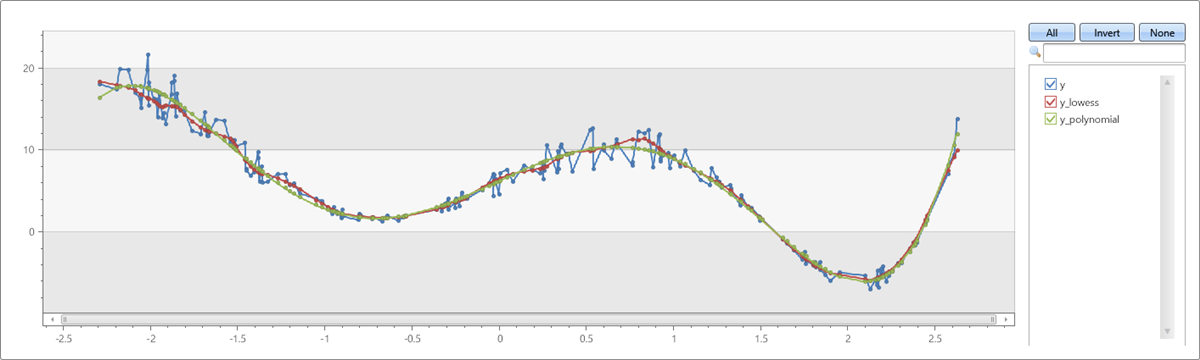
Compare LOWESS versus polynomial fit
To use a query-defined function, invoke it after the embedded function definition.
let series_fit_lowess_fl=(tbl:(*), y_series:string, y_fit_series:string, fit_size:int=5, x_series:string='', x_istime:bool=False)
{
    let kwargs = bag_pack('y_series', y_series, 'y_fit_series', y_fit_series, 'fit_size', fit_size, 'x_series', x_series, 'x_istime', x_istime);
    let code = ```if 1:
        y_series = kargs["y_series"]
        y_fit_series = kargs["y_fit_series"]
        fit_size = kargs["fit_size"]
        x_series = kargs["x_series"]
        x_istime = kargs["x_istime"]
        import statsmodels.api as sm
        def lowess_fit(ts_row, x_col, y_col, fsize):
            y = ts_row[y_col]
            fraction = fsize/len(y)
            if x_col == "": # If there is no x column creates sequential range [1, len(y)]
               x = np.arange(len(y)) + 1
            else: # if x column exists check whether its a time column. If so, normalize it to the [1, len(y)] range, else take it as is.
               if x_istime:
                   x = pd.to_numeric(pd.to_datetime(ts_row[x_col]))
                   x = x - x.min()
                   x = x / x.max()
                   x = x * (len(x) - 1) + 1
               else:
                   x = ts_row[x_col]
            lowess = sm.nonparametric.lowess
            z = lowess(y, x, return_sorted=False, frac=fraction)
            return list(z)
        result = df
        result[y_fit_series] = df.apply(lowess_fit, axis=1, args=(x_series, y_series, fit_size))
    ```;
    tbl
     | evaluate python(typeof(*), code, kwargs)
};
range x from 1 to 200 step 1
| project x = rand()*5 - 2.3
| extend y = pow(x, 5)-8*pow(x, 3)+10*x+6
| extend y = y + (rand() - 0.5)*0.5*y
| summarize x=make_list(x), y=make_list(y)
| extend y_lowess = dynamic(null)
| invoke series_fit_lowess_fl('y', 'y_lowess', 15, 'x')
| extend series_fit_poly(y, x, 5)
| project x, y, y_lowess, y_polynomial=series_fit_poly_y_poly_fit
| render linechart
Output