activity_engagement plugin
Calculates activity engagement ratio based on ID column over a sliding timeline window.
The activity_engagement plugin can be used for calculating DAU/WAU/MAU (daily/weekly/monthly activities).
Syntax
T | evaluate activity_engagement(IdColumn, TimelineColumn, [Start, End,] InnerActivityWindow, OuterActivityWindow [, dim1, dim2, ...])
Learn more about syntax conventions.
Parameters
| Name | Type | Required | Description |
|---|---|---|---|
| T | string |
✔️ | The tabular input used to calculate engagement. |
| IdCoumn | string |
✔️ | The name of the column with ID values that represent user activity. |
| TimelineColumn | string |
✔️ | The name of the column that represents timeline. |
| Start | datetime |
The analysis start period. | |
| End | datetime |
The analysis end period. | |
| InnerActivityWindow | timespan |
✔️ | The inner-scope analysis window period. |
| OuterActivityWindow | timespan |
✔️ | The outer-scope analysis window period. |
| dim1, dim2, ... | dynamic |
An array of the dimensions columns that slice the activity metrics calculation. |
Returns
Returns a table that has a distinct count of ID values inside an inner-scope window, inside an outer-scope window, and the activity ratio for each inner-scope window period for each existing dimensions combination.
Output table schema is:
| TimelineColumn | dcount_activities_inner | dcount_activities_outer | activity_ratio | dim1 | .. | dim_n |
|---|---|---|---|---|---|---|
| type: as of TimelineColumn | long |
long | double | .. | .. | .. |
Examples
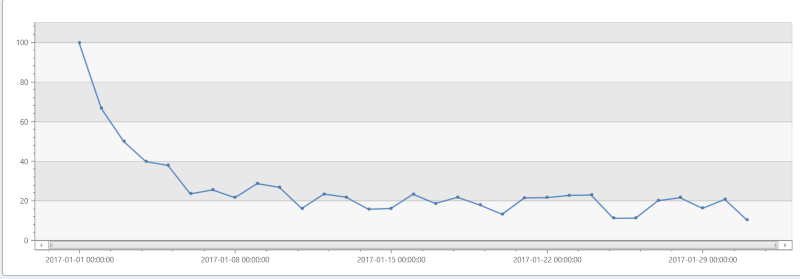
DAU/WAU calculation
The following example calculates DAU/WAU (Daily Active Users / Weekly Active Users ratio) over a randomly generated data.
// Generate random data of user activities
let _start = datetime(2017-01-01);
let _end = datetime(2017-01-31);
range _day from _start to _end  step 1d
| extend d = tolong((_day - _start)/1d)
| extend r = rand()+1
| extend _users=range(tolong(d*50*r), tolong(d*50*r+100*r-1), 1)
| mv-expand id=_users to typeof(long) limit 1000000
// Calculate DAU/WAU ratio
| evaluate activity_engagement(['id'], _day, _start, _end, 1d, 7d)
| project _day, Dau_Wau=activity_ratio*100
| render timechart
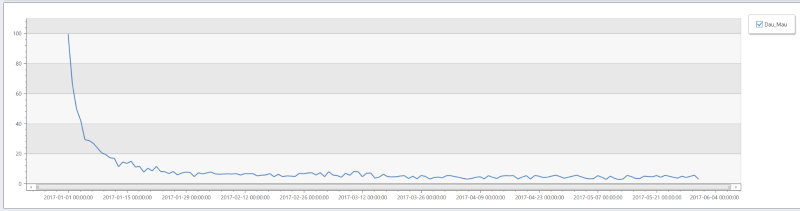
DAU/MAU calculation
The following example calculates DAU/WAU (Daily Active Users / Weekly Active Users ratio) over a randomly generated data.
// Generate random data of user activities
let _start = datetime(2017-01-01);
let _end = datetime(2017-05-31);
range _day from _start to _end  step 1d
| extend d = tolong((_day - _start)/1d)
| extend r = rand()+1
| extend _users=range(tolong(d*50*r), tolong(d*50*r+100*r-1), 1)
| mv-expand id=_users to typeof(long) limit 1000000
// Calculate DAU/MAU ratio
| evaluate activity_engagement(['id'], _day, _start, _end, 1d, 30d)
| project _day, Dau_Mau=activity_ratio*100
| render timechart
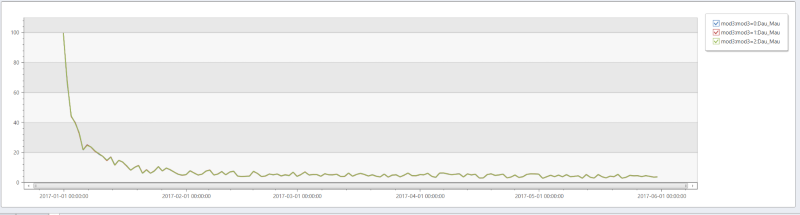
DAU/MAU calculation with additional dimensions
The following example calculates DAU/WAU (Daily Active Users / Weekly Active Users ratio) over a randomly generated data with additional dimension (mod3).
// Generate random data of user activities
let _start = datetime(2017-01-01);
let _end = datetime(2017-05-31);
range _day from _start to _end  step 1d
| extend d = tolong((_day - _start)/1d)
| extend r = rand()+1
| extend _users=range(tolong(d*50*r), tolong(d*50*r+100*r-1), 1)
| mv-expand id=_users to typeof(long) limit 1000000
| extend mod3 = strcat("mod3=", id % 3)
// Calculate DAU/MAU ratio
| evaluate activity_engagement(['id'], _day, _start, _end, 1d, 30d, mod3)
| project _day, Dau_Mau=activity_ratio*100, mod3
| render timechart