Note
Access to this page requires authorization. You can try signing in or changing directories.
Access to this page requires authorization. You can try changing directories.
Switch services using the Version drop-down list. Learn more about navigation.
Applies to: ✅ Azure Data Explorer
Calculates activity engagement ratio based on ID column over a sliding timeline window.
The activity_engagement plugin can be used for calculating DAU/WAU/MAU (daily/weekly/monthly activities).
Syntax
T | evaluate activity_engagement(IdColumn, TimelineColumn, [Start, End,] InnerActivityWindow, OuterActivityWindow [, dim1, dim2, ...])
Learn more about syntax conventions.
Parameters
| Name | Type | Required | Description |
|---|---|---|---|
| T | string |
✔️ | The tabular input used to calculate engagement. |
| IdCoumn | string |
✔️ | The name of the column with ID values that represent user activity. |
| TimelineColumn | string |
✔️ | The name of the column that represents timeline. |
| Start | datetime |
The analysis start period. | |
| End | datetime |
The analysis end period. | |
| InnerActivityWindow | timespan |
✔️ | The inner-scope analysis window period. |
| OuterActivityWindow | timespan |
✔️ | The outer-scope analysis window period. |
| dim1, dim2, ... | dynamic |
An array of the dimensions columns that slice the activity metrics calculation. |
Returns
Returns a table that has a distinct count of ID values inside an inner-scope window, inside an outer-scope window, and the activity ratio for each inner-scope window period for each existing dimensions combination.
Output table schema is:
| TimelineColumn | dcount_activities_inner | dcount_activities_outer | activity_ratio | dim1 | .. | dim_n |
|---|---|---|---|---|---|---|
| type: as of TimelineColumn | long |
long | double | .. | .. | .. |
Examples
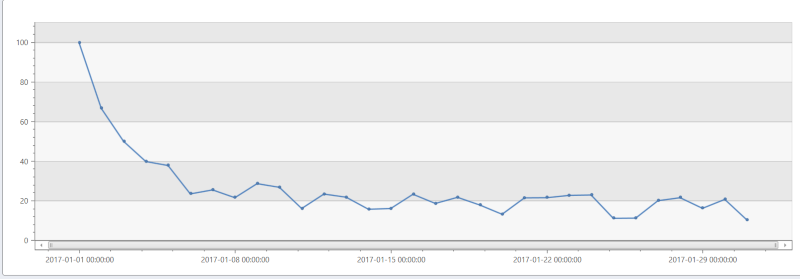
The following example calculates DAU/WAU (Daily Active Users / Weekly Active Users ratio) over a randomly generated data.
// Generate random data of user activities
let _start = datetime(2017-01-01);
let _end = datetime(2017-01-31);
range _day from _start to _end  step 1d
| extend d = tolong((_day - _start)/1d)
| extend r = rand()+1
| extend _users=range(tolong(d*50*r), tolong(d*50*r+100*r-1), 1)
| mv-expand id=_users to typeof(long) limit 1000000
// Calculate DAU/WAU ratio
| evaluate activity_engagement(['id'], _day, _start, _end, 1d, 7d)
| project _day, Dau_Wau=activity_ratio*100
| render timechart
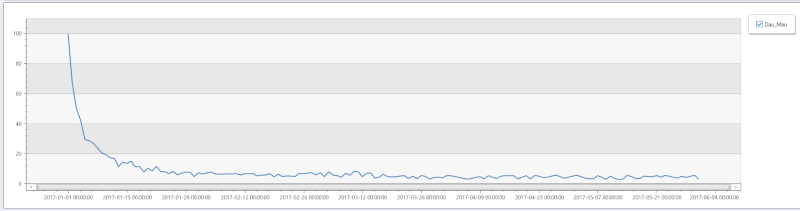
The following example calculates DAU/WAU (Daily Active Users / Weekly Active Users ratio) over a randomly generated data.
// Generate random data of user activities
let _start = datetime(2017-01-01);
let _end = datetime(2017-05-31);
range _day from _start to _end  step 1d
| extend d = tolong((_day - _start)/1d)
| extend r = rand()+1
| extend _users=range(tolong(d*50*r), tolong(d*50*r+100*r-1), 1)
| mv-expand id=_users to typeof(long) limit 1000000
// Calculate DAU/MAU ratio
| evaluate activity_engagement(['id'], _day, _start, _end, 1d, 30d)
| project _day, Dau_Mau=activity_ratio*100
| render timechart
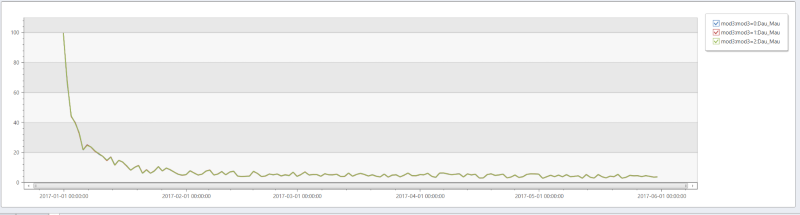
The following example calculates DAU/WAU (Daily Active Users / Weekly Active Users ratio) over a randomly generated data with additional dimension (mod3).
// Generate random data of user activities
let _start = datetime(2017-01-01);
let _end = datetime(2017-05-31);
range _day from _start to _end  step 1d
| extend d = tolong((_day - _start)/1d)
| extend r = rand()+1
| extend _users=range(tolong(d*50*r), tolong(d*50*r+100*r-1), 1)
| mv-expand id=_users to typeof(long) limit 1000000
| extend mod3 = strcat("mod3=", id % 3)
// Calculate DAU/MAU ratio
| evaluate activity_engagement(['id'], _day, _start, _end, 1d, 30d, mod3)
| project _day, Dau_Mau=activity_ratio*100, mod3
| render timechart