Note
Access to this page requires authorization. You can try signing in or changing directories.
Access to this page requires authorization. You can try changing directories.
Switch services using the Version drop-down list. Learn more about navigation.
Applies to: ✅ Azure Data Explorer ✅ Azure Monitor ✅ Microsoft Sentinel
Calculates an estimate of the number of distinct values that are taken by a scalar expression in the summary group.
Null values are ignored and don't factor into the calculation.
Note
The dcount() aggregation function is primarily useful for estimating the cardinality of huge sets. It trades accuracy for performance, and might return a result that varies between executions. The order of inputs might have an effect on its output.
Note
This function is used in conjunction with the summarize operator.
Syntax
dcount (expr[, accuracy])
Learn more about syntax conventions.
Parameters
| Name | Type | Required | Description |
|---|---|---|---|
| expr | string |
✔️ | The input whose distinct values are to be counted. |
| accuracy | int |
The value that defines the requested estimation accuracy. The default value is 1. See Estimation accuracy for supported values. |
Returns
Returns an estimate of the number of distinct values of expr in the group.
Examples
The following example shows how many types of storm events happened in each state.
StormEvents
| summarize DifferentEvents=dcount(EventType) by State
| order by DifferentEvents
The results table shown includes only the first 10 rows.
| State | DifferentEvents |
|---|---|
| TEXAS | 27 |
| CALIFORNIA | 26 |
| PENNSYLVANIA | 25 |
| GEORGIA | 24 |
| ILLINOIS | 23 |
| MARYLAND | 23 |
| NORTH CAROLINA | 23 |
| MICHIGAN | 22 |
| FLORIDA | 22 |
| OREGON | 21 |
| KANSAS | 21 |
| ... | ... |
Estimation accuracy
This function uses a variant of the HyperLogLog (HLL) algorithm, which does a stochastic estimation of set cardinality. The algorithm provides a "knob" that can be used to balance accuracy and execution time per memory size:
| Accuracy | Error (%) | Entry count |
|---|---|---|
| 0 | 1.6 | 212 |
| 1 | 0.8 | 214 |
| 2 | 0.4 | 216 |
| 3 | 0.28 | 217 |
| 4 | 0.2 | 218 |
Note
The "entry count" column is the number of 1-byte counters in the HLL implementation.
The algorithm includes some provisions for doing a perfect count (zero error), if the set cardinality is small enough:
- When the accuracy level is
1, 1000 values are returned - When the accuracy level is
2, 8000 values are returned
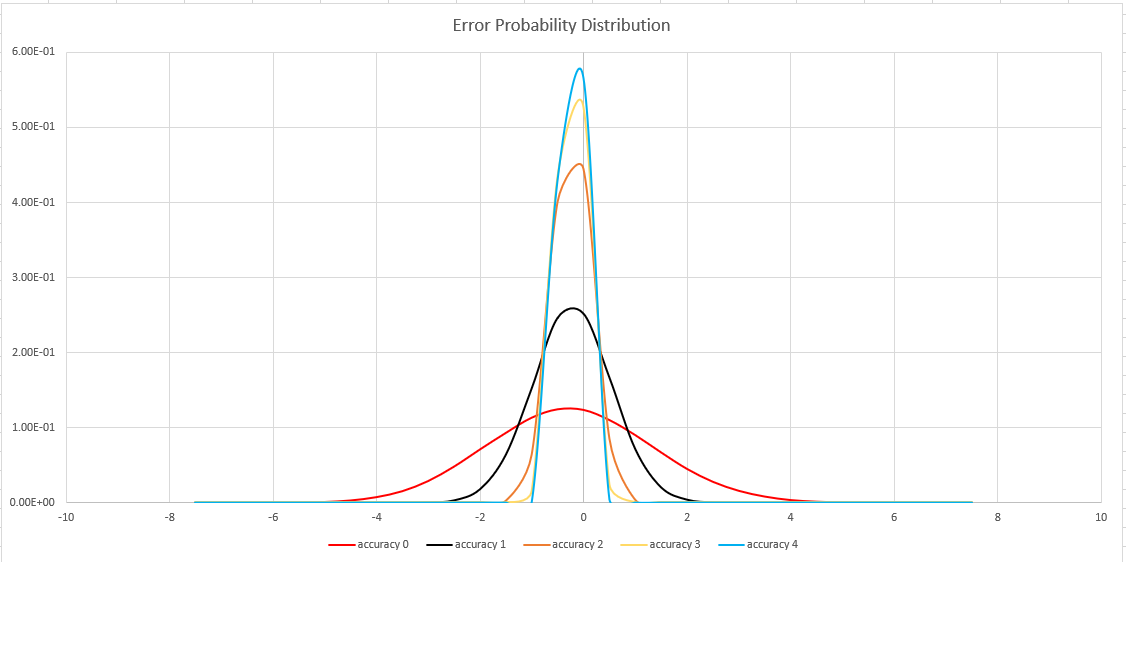
The error bound is probabilistic, not a theoretical bound. The value is the standard deviation of error distribution (the sigma), and 99.7% of the estimations will have a relative error of under 3 x sigma.
The following image shows the probability distribution function of the relative estimation error, in percentages, for all supported accuracy settings: