Note
Access to this page requires authorization. You can try signing in or changing directories.
Access to this page requires authorization. You can try changing directories.
Switch services using the Version drop-down list. Learn more about navigation.
Applies to: ✅ Azure Data Explorer ✅ Azure Monitor ✅ Microsoft Sentinel
The make-graph operator builds a graph structure from tabular inputs of edges and nodes.
Syntax
Edges | make-graph SourceNodeId --> TargetNodeId [ with Nodes1 on NodeId1 [, Nodes2 on NodeId2 ]]
Edges | make-graph SourceNodeId --> TargetNodeId [ with_node_id= NodeIdPropertyName ]
Edges | make-graph SourceNodeId --> TargetNodeId [ with Nodes1 on NodeId1 [, Nodes2 on NodeId2 ]] partitioned-by PartitionColumn ( GraphOperator )
Parameters
| Name | Type | Required | Description |
|---|---|---|---|
| Edges | string |
✔️ | The tabular source containing the edges of the graph, each row represents an edge in the graph. |
| SourceNodeId | string |
✔️ | The column in Edges with the source node IDs of the edges. |
| TargetNodeId | string |
✔️ | The column in Edges with the target node IDs of the edges. |
| Nodes1, Nodes2 | string |
The tabular expressions containing the properties of the nodes in the graph. | |
| NodesId1, NodesId2 | string |
The corresponding columns with the node IDs in Nodes1, Nodes2 respectively. | |
| NodeIdPropertyName | string |
The name of the property for node ID on the nodes of the graph. | |
| PartitionColumn | string |
The column to partition the graph by. Creates separate graphs for each unique value in this column. | |
| GraphOperator | string |
The graph operator to apply to each partitioned graph. |
Returns
The make-graph operator returns a graph expression and must be followed by a graph operator. Each row in the source Edges expression becomes an edge in the graph with properties that are the column values of the row. Each row in the Nodes tabular expression becomes a node in the graph with properties that are the column values of the row. Nodes that appear in the Edges table but don't have a corresponding row in the Nodes table are created as nodes with the corresponding node ID and empty properties.
When using the partitioned-by clause, separate graphs are created for each unique value in the specified PartitionColumn. The specified GraphOperator is then applied to each partitioned graph independently, and the results are combined into a single output. This is particularly useful for multitenant scenarios where you want to analyze each tenant's data separately while maintaining the same graph structure and analysis logic.
Important
When using the partitioned-by clause, both the Edges table and all Nodes tables must contain the partition column.
Note
Each node has a unique identifier. If the same node ID appears in both the Nodes1 and Nodes2 tables, a single node is created by merging their properties. If there are conflicting property values for the same node, one of the values is arbitrarily chosen.
Users can handle node information in the following ways:
- No node information required:
make-graphcompletes with source and target. - Explicit node properties: use up to two tabular expressions using "
withNodes1onNodeId1 [,Nodes2onNodeId2 ]." - Default node identifier: use "
with_node_id=DefaultNodeId."
Example
Edges and nodes graph
The following example builds a graph from edges and nodes tables. The nodes represent people and systems, and the edges represent different relationships between nodes. The make-graph operator builds the graph. Then, the graph-match operator is used with a graph pattern to search for attack paths leading to the "Trent" system node.
let nodes = datatable(name:string, type:string, age:int)
[
  "Alice", "Person", 23,
  "Bob", "Person", 31,
  "Eve", "Person", 17,
  "Mallory", "Person", 29,
  "Trent", "System", 99
];
let edges = datatable(Source:string, Destination:string, edge_type:string)
[
  "Alice", "Bob", "communicatesWith",
  "Alice", "Trent", "trusts",
  "Bob", "Trent", "hasPermission",
  "Eve", "Alice", "attacks",
  "Mallory", "Alice", "attacks",
  "Mallory", "Bob", "attacks"
];
edges
| make-graph Source --> Destination with nodes on name
| graph-match (mallory)-[attacks]->(compromised)-[hasPermission]->(trent)
  where mallory.name == "Mallory" and trent.name == "Trent" and attacks.edge_type == "attacks" and hasPermission.edge_type == "hasPermission"
  project Attacker = mallory.name, Compromised = compromised.name, System = trent.name
Output
| Attacker | Compromised | System |
|---|---|---|
| Mallory | Bob | Trent |
Default node identifier
The following example builds a graph using only edges, with the name property as the default node identifier. This approach is useful when creating a graph from a tabular expression of edges, ensuring that the node identifier is available for the constraints section of the subsequent graph-match operator.
let edges = datatable(source:string, destination:string, edge_type:string)
[
  "Alice", "Bob", "communicatesWith",
  "Alice", "Trent", "trusts",
  "Bob", "Trent", "hasPermission",
  "Eve", "Alice", "attacks",
  "Mallory", "Alice", "attacks",
  "Mallory", "Bob", "attacks"
];
edges
| make-graph source --> destination with_node_id=name
| graph-match (mallory)-[attacks]->(compromised)-[hasPermission]->(trent)
  where mallory.name == "Mallory" and trent.name == "Trent" and attacks.edge_type == "attacks" and hasPermission.edge_type == "hasPermission"
  project Attacker = mallory.name, Compromised = compromised.name, System = trent.name
Output
| Attacker | Compromised | System |
|---|---|---|
| Mallory | Bob | Trent |
Partitioned graph
This example demonstrates using the partitioned-by clause to analyze a multitenant social network. The partitioned-by clause creates separate graphs for each unique value in the partition column (in this case, tenantId), applies the graph operator to each partition independently, and combines the results.
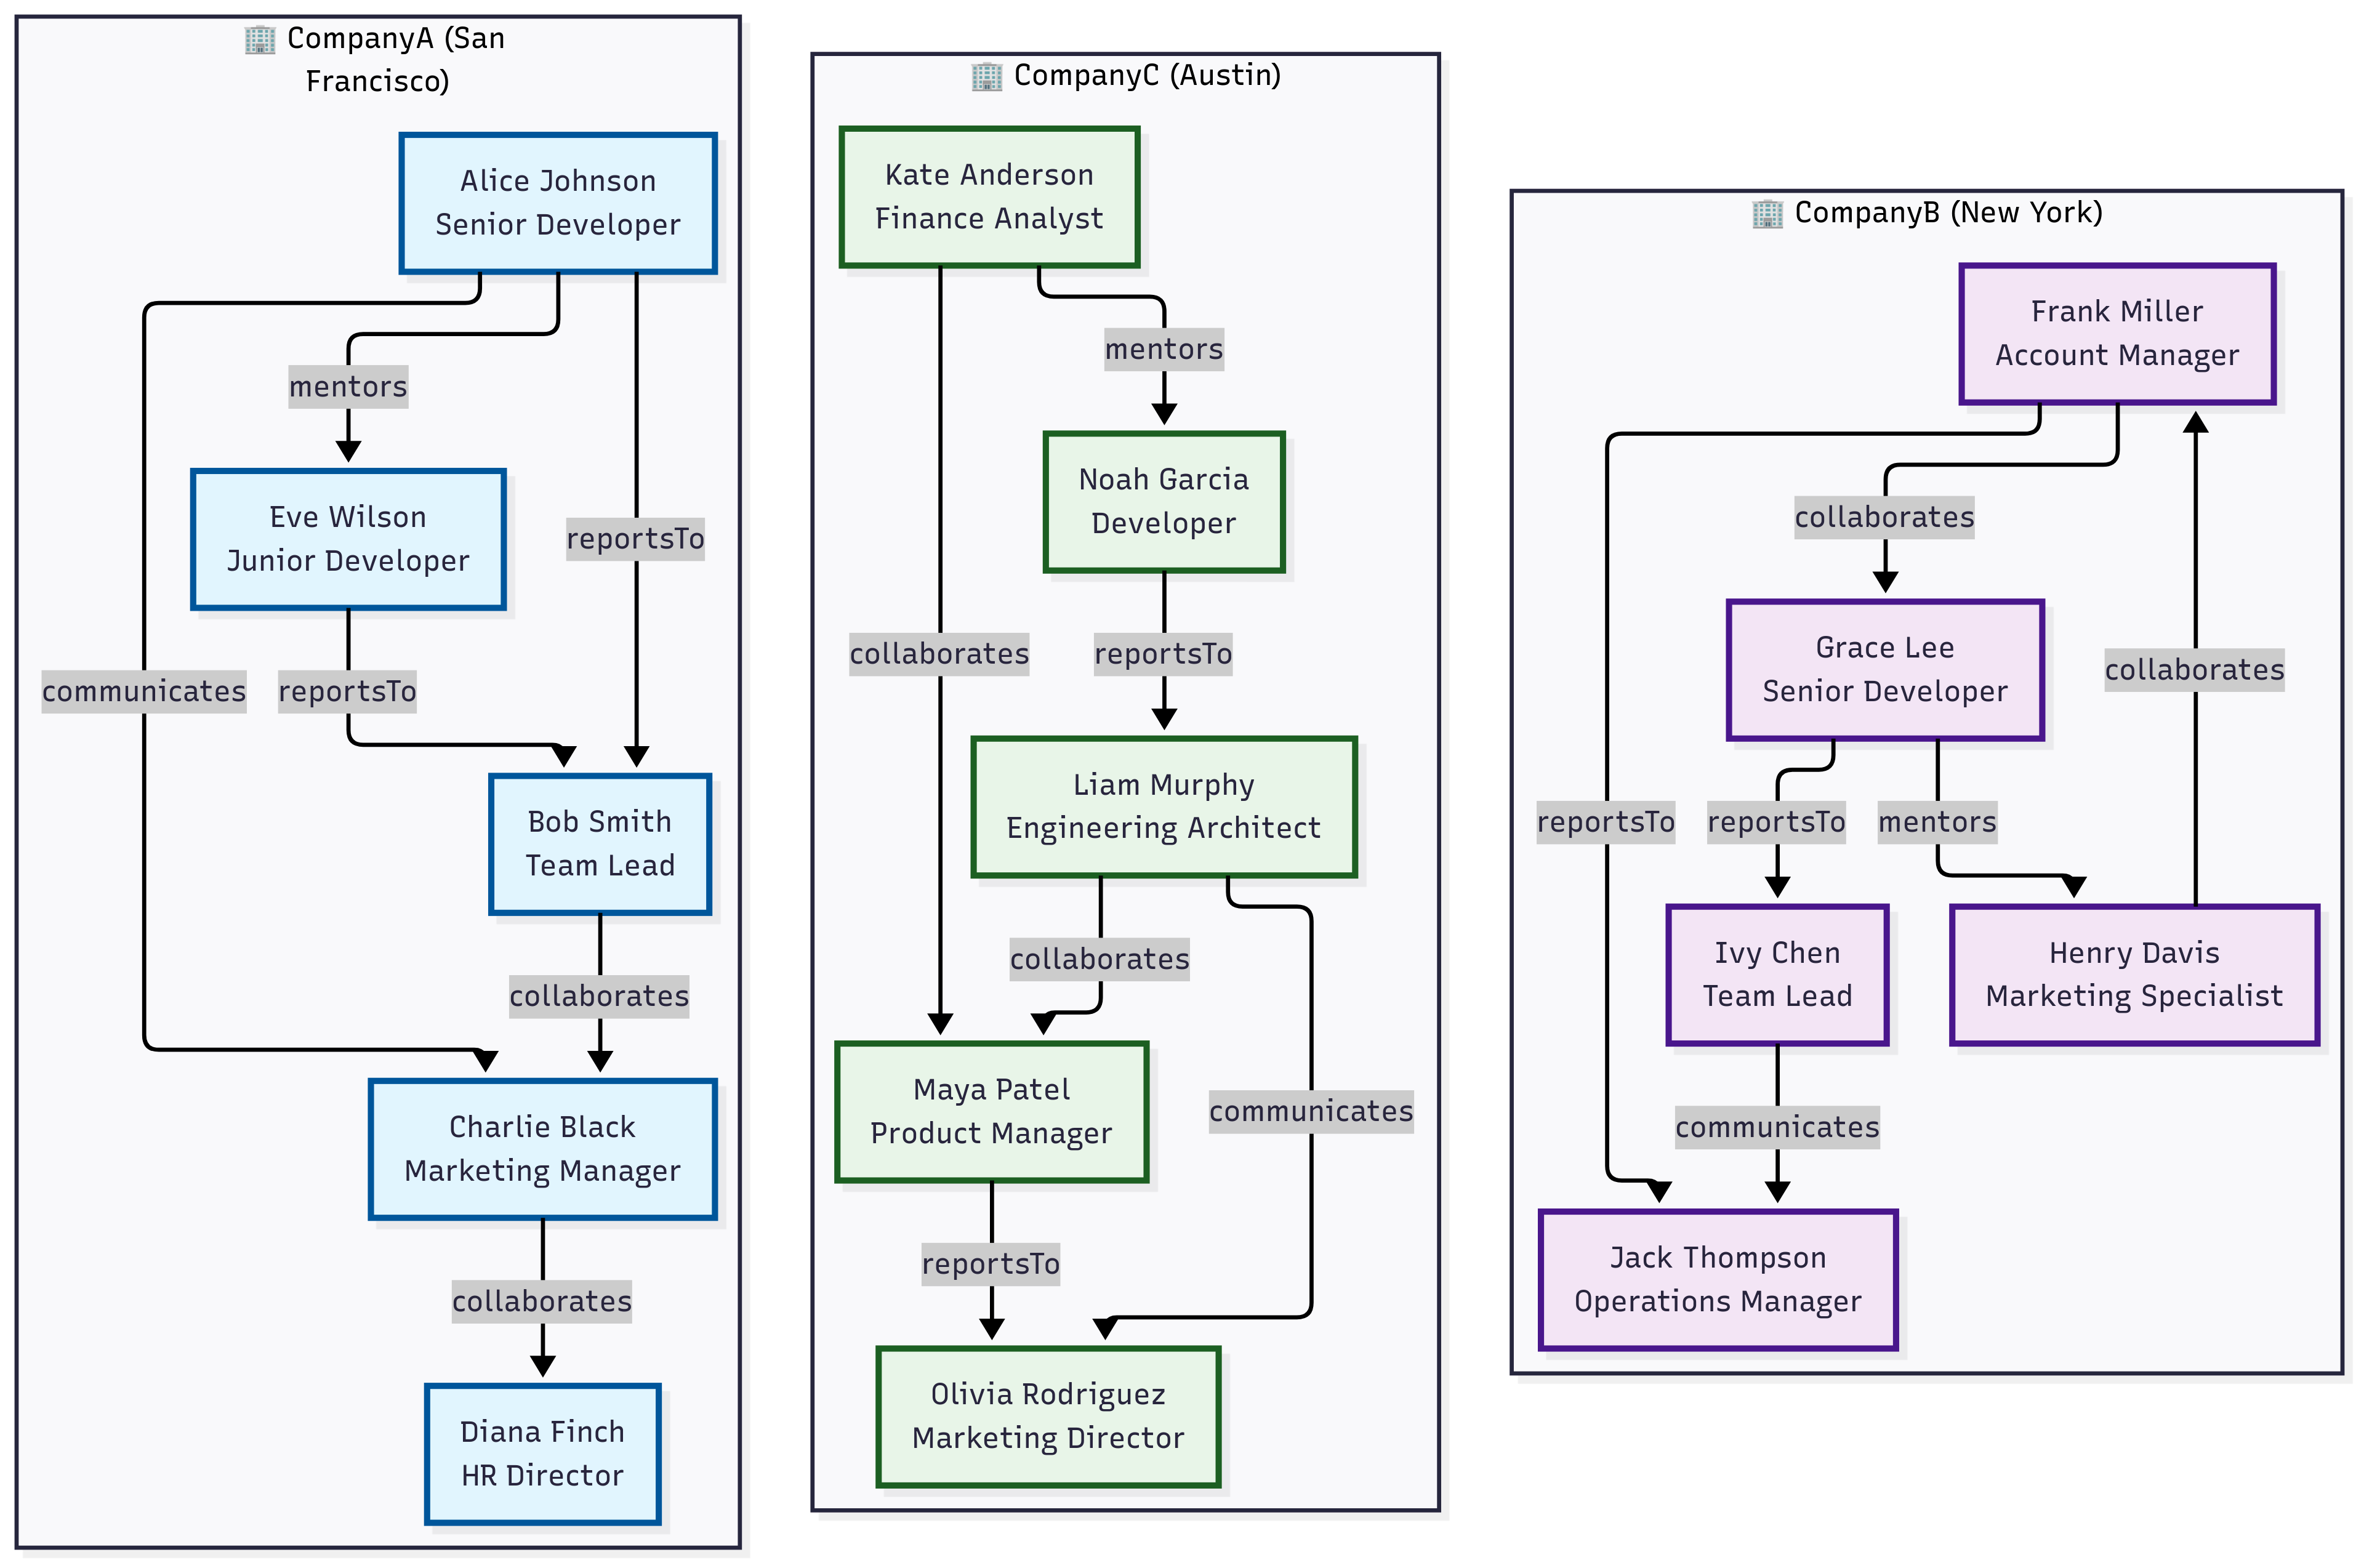
// Nodes table representing users across multiple tenants (organizations)
let nodes = datatable(userId:string, tenantId:string, name:string, department:string, role:string, location:dynamic)
[
    // Tenant: CompanyA - San Francisco Bay Area
    "u001", "CompanyA", "Alice Johnson", "Engineering", "Senior Developer", dynamic({"type": "Point", "coordinates": [-122.4194, 37.7749]}),
    "u002", "CompanyA", "Bob Smith", "Engineering", "Team Lead", dynamic({"type": "Point", "coordinates": [-122.4094, 37.7849]}),
    "u003", "CompanyA", "Charlie Black", "Marketing", "Manager", dynamic({"type": "Point", "coordinates": [-122.4294, 37.7649]}),
    "u004", "CompanyA", "Diana Finch", "HR", "Director", dynamic({"type": "Point", "coordinates": [-122.3994, 37.7949]}),
    "u005", "CompanyA", "Eve Wilson", "Engineering", "Junior Developer", dynamic({"type": "Point", "coordinates": [-122.4394, 37.7549]}),
    // Tenant: CompanyB - New York Area
    "u006", "CompanyB", "Frank Miller", "Sales", "Account Manager", dynamic({"type": "Point", "coordinates": [-74.0060, 40.7128]}),
    "u007", "CompanyB", "Grace Lee", "Engineering", "Senior Developer", dynamic({"type": "Point", "coordinates": [-74.0160, 40.7228]}),
    "u008", "CompanyB", "Henry Davis", "Marketing", "Specialist", dynamic({"type": "Point", "coordinates": [-73.9960, 40.7028]}),
    "u009", "CompanyB", "Ivy Chen", "Engineering", "Team Lead", dynamic({"type": "Point", "coordinates": [-74.0260, 40.7328]}),
    "u010", "CompanyB", "Jack Thompson", "Operations", "Manager", dynamic({"type": "Point", "coordinates": [-73.9860, 40.6928]}),
    // Tenant: CompanyC - Austin Area
    "u011", "CompanyC", "Kate Anderson", "Finance", "Analyst", dynamic({"type": "Point", "coordinates": [-97.7431, 30.2672]}),
    "u012", "CompanyC", "Liam Murphy", "Engineering", "Architect", dynamic({"type": "Point", "coordinates": [-97.7331, 30.2772]}),
    "u013", "CompanyC", "Maya Patel", "Product", "Manager", dynamic({"type": "Point", "coordinates": [-97.7531, 30.2572]}),
    "u014", "CompanyC", "Noah Garcia", "Engineering", "Developer", dynamic({"type": "Point", "coordinates": [-97.7631, 30.2472]}),
    "u015", "CompanyC", "Olivia Rodriguez", "Marketing", "Director", dynamic({"type": "Point", "coordinates": [-97.7231, 30.2872]})
];
// Edges table representing relationships/interactions between users
let edges = datatable(sourceUserId:string, targetUserId:string, tenantId:string, relationshipType:string, strength:int)
[
    // CompanyA relationships
    "u001", "u002", "CompanyA", "reportsTo", 9,
    "u005", "u002", "CompanyA", "reportsTo", 8,
    "u002", "u003", "CompanyA", "collaborates", 6,
    "u001", "u005", "CompanyA", "mentors", 7,
    "u003", "u004", "CompanyA", "collaborates", 5,
    "u001", "u003", "CompanyA", "communicates", 4,
    // CompanyB relationships
    "u007", "u009", "CompanyB", "reportsTo", 9,
    "u006", "u010", "CompanyB", "reportsTo", 8,
    "u008", "u006", "CompanyB", "collaborates", 6,
    "u009", "u010", "CompanyB", "communicates", 5,
    "u007", "u008", "CompanyB", "mentors", 7,
    "u006", "u007", "CompanyB", "collaborates", 6,
    // CompanyC relationships
    "u014", "u012", "CompanyC", "reportsTo", 9,
    "u012", "u013", "CompanyC", "collaborates", 7,
    "u011", "u013", "CompanyC", "collaborates", 6,
    "u013", "u015", "CompanyC", "reportsTo", 8,
    "u012", "u015", "CompanyC", "communicates", 5,
    "u011", "u014", "CompanyC", "mentors", 6
];
edges
| make-graph sourceUserId --> targetUserId with nodes on userId partitioned-by tenantId (
    graph-match cycles=none (n1)-[e*2..4]->(n2)
        where n1.userId != n2.userId and all(e, relationshipType == "collaborates") and
            geo_distance_2points(todouble(n1.location.coordinates[0]), todouble(n1.location.coordinates[1]),
                             todouble(n2.location.coordinates[0]), todouble(n2.location.coordinates[1])) < 10000
        project Start = strcat(n1.name, " (", n1.tenantId, ")"), Tenants = map(e, tenantId), End = strcat(n2.name, " (", n2.tenantId, ")")
)
| Start | Tenants | End |
|---|---|---|
| Bob Smith (CompanyA) | [ "CompanyA", "CompanyA" ] |
Diana Finch (CompanyA) |
| Henry Davis (CompanyB) | [ "CompanyB", "CompanyB" ] |
Grace Lee (CompanyB) |