make-series operator
Create series of specified aggregated values along a specified axis.
Syntax
T | make-series [MakeSeriesParameters]
[Column =] Aggregation [default = DefaultValue] [, ...]
on AxisColumn [from start] [to end] step step
[by
[Column =] GroupExpression [, ...]]
Learn more about syntax conventions.
Parameters
| Name | Type | Required | Description |
|---|---|---|---|
| Column | string |
The name for the result column. Defaults to a name derived from the expression. | |
| DefaultValue | scalar | A default value to use instead of absent values. If there's no row with specific values of AxisColumn and GroupExpression, then the corresponding element of the array will be assigned a DefaultValue. Default is 0. | |
| Aggregation | string |
✔️ | A call to an aggregation function, such as count() or avg(), with column names as arguments. See the list of aggregation functions. Only aggregation functions that return numeric results can be used with the make-series operator. |
| AxisColumn | string |
✔️ | The column by which the series will be ordered. Usually the column values will be of type datetime or timespan but all numeric types are accepted. |
| start | scalar | ✔️ | The low bound value of the AxisColumn for each of the series to be built. If start is not specified, it will be the first bin, or step, that has data in each series. |
| end | scalar | ✔️ | The high bound non-inclusive value of the AxisColumn. The last index of the time series is smaller than this value and will be start plus integer multiple of step that is smaller than end. If end is not specified, it will be the upper bound of the last bin, or step, that has data per each series. |
| step | scalar | ✔️ | The difference, or bin size, between two consecutive elements of the AxisColumn array. For a list of possible time intervals, see timespan. |
| GroupExpression | An expression over the columns that provides a set of distinct values. Typically it's a column name that already provides a restricted set of values. | ||
| MakeSeriesParameters | Zero or more space-separated parameters in the form of Name = Value that control the behavior. See supported make series parameters. |
Note
The start, end, and step parameters are used to build an array of AxisColumn values. The array consists of values between start and end, with the step value representing the difference between one array element to the next. All Aggregation values are ordered respectively to this array.
Supported make series parameters
| Name | Description |
|---|---|
kind |
Produces default result when the input of make-series operator is empty. Value: nonempty |
hint.shufflekey=<key> |
The shufflekey query shares the query load on cluster nodes, using a key to partition data. See shuffle query |
Note
The arrays generated by make-series are limited to 1048576 values (2^20). Trying to generate a larger array with make-series would result in either an error or a truncated array.
Alternate Syntax
T | make-series
[Column =] Aggregation [default = DefaultValue] [, ...]
on AxisColumn in range(start, stop, step)
[by
[Column =] GroupExpression [, ...]]
The generated series from the alternate syntax differs from the main syntax in two aspects:
- The stop value is inclusive.
- Binning the index axis is generated with bin() and not bin_at(), which means that start may not be included in the generated series.
It's recommended to use the main syntax of make-series and not the alternate syntax.
Returns
The input rows are arranged into groups having the same values of the by expressions and the bin_at(AxisColumn,step,start) expression. Then the specified aggregation functions are computed over each group, producing a row for each group. The result contains the by columns, AxisColumn column and also at least one column for each computed aggregate. (Aggregations over multiple columns or non-numeric results aren't supported.)
This intermediate result has as many rows as there are distinct combinations of by and bin_at(AxisColumn,step,start) values.
Finally the rows from the intermediate result arranged into groups having the same values of the by expressions and all aggregated values are arranged into arrays (values of dynamic type). For each aggregation, there's one column containing its array with the same name. The last column is an array containing the values of AxisColumn binned according to the specified step.
Note
Although you can provide arbitrary expressions for both the aggregation and grouping expressions, it's more efficient to use simple column names.
List of aggregation functions
| Function | Description |
|---|---|
| avg() | Returns an average value across the group |
| avgif() | Returns an average with the predicate of the group |
| count() | Returns a count of the group |
| countif() | Returns a count with the predicate of the group |
| dcount() | Returns an approximate distinct count of the group elements |
| dcountif() | Returns an approximate distinct count with the predicate of the group |
| max() | Returns the maximum value across the group |
| maxif() | Returns the maximum value with the predicate of the group |
| min() | Returns the minimum value across the group |
| minif() | Returns the minimum value with the predicate of the group |
| percentile() | Returns the percentile value across the group |
| take_any() | Returns a random non-empty value for the group |
| stdev() | Returns the standard deviation across the group |
| sum() | Returns the sum of the elements within the group |
| sumif() | Returns the sum of the elements with the predicate of the group |
| variance() | Returns the variance across the group |
List of series analysis functions
| Function | Description |
|---|---|
| series_fir() | Applies Finite Impulse Response filter |
| series_iir() | Applies Infinite Impulse Response filter |
| series_fit_line() | Finds a straight line that is the best approximation of the input |
| series_fit_line_dynamic() | Finds a line that is the best approximation of the input, returning dynamic object |
| series_fit_2lines() | Finds two lines that are the best approximation of the input |
| series_fit_2lines_dynamic() | Finds two lines that are the best approximation of the input, returning dynamic object |
| series_outliers() | Scores anomaly points in a series |
| series_periods_detect() | Finds the most significant periods that exist in a time series |
| series_periods_validate() | Checks whether a time series contains periodic patterns of given lengths |
| series_stats_dynamic() | Return multiple columns with the common statistics (min/max/variance/stdev/average) |
| series_stats() | Generates a dynamic value with the common statistics (min/max/variance/stdev/average) |
For a complete list of series analysis functions, see: Series processing functions
List of series interpolation functions
| Function | Description |
|---|---|
| series_fill_backward() | Performs backward fill interpolation of missing values in a series |
| series_fill_const() | Replaces missing values in a series with a specified constant value |
| series_fill_forward() | Performs forward fill interpolation of missing values in a series |
| series_fill_linear() | Performs linear interpolation of missing values in a series |
- Note: Interpolation functions by default assume
nullas a missing value. Therefore specifydefault=double(null) inmake-seriesif you intend to use interpolation functions for the series.
Examples
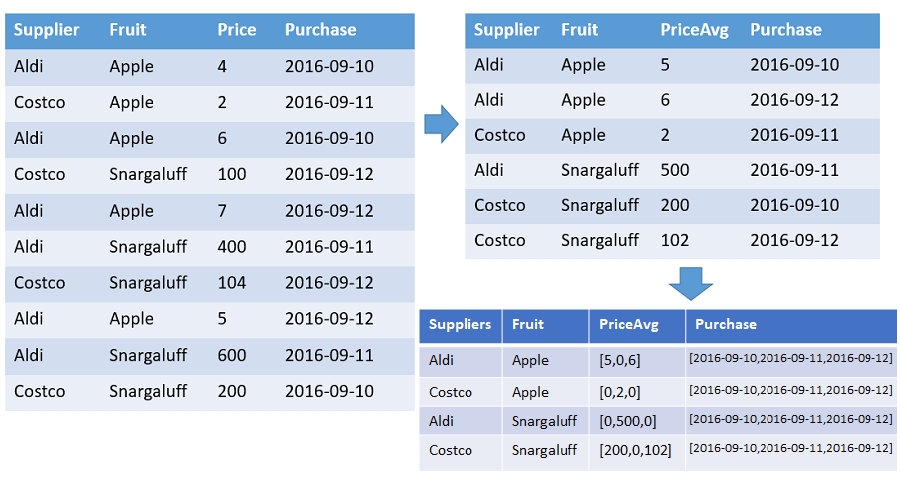
A table that shows arrays of the numbers and average prices of each fruit from each supplier ordered by the timestamp with specified range. There's a row in the output for each distinct combination of fruit and supplier. The output columns show the fruit, supplier, and arrays of: count, average, and the whole timeline (from 2016-01-01 until 2016-01-10). All arrays are sorted by the respective timestamp and all gaps are filled with default values (0 in this example). All other input columns are ignored.
T | make-series PriceAvg=avg(Price) default=0
on Purchase from datetime(2016-09-10) to datetime(2016-09-13) step 1d by Supplier, Fruit
let data=datatable(timestamp:datetime, metric: real)
[
  datetime(2016-12-31T06:00), 50,
  datetime(2017-01-01), 4,
  datetime(2017-01-02), 3,
  datetime(2017-01-03), 4,
  datetime(2017-01-03T03:00), 6,
  datetime(2017-01-05), 8,
  datetime(2017-01-05T13:40), 13,
  datetime(2017-01-06), 4,
  datetime(2017-01-07), 3,
  datetime(2017-01-08), 8,
  datetime(2017-01-08T21:00), 8,
  datetime(2017-01-09), 2,
  datetime(2017-01-09T12:00), 11,
  datetime(2017-01-10T05:00), 5,
];
let interval = 1d;
let stime = datetime(2017-01-01);
let etime = datetime(2017-01-10);
data
| make-series avg(metric) on timestamp from stime to etime step interval
| avg_metric | timestamp |
|---|---|
| [ 4.0, 3.0, 5.0, 0.0, 10.5, 4.0, 3.0, 8.0, 6.5 ] | [ "2017-01-01T00:00:00.0000000Z", "2017-01-02T00:00:00.0000000Z", "2017-01-03T00:00:00.0000000Z", "2017-01-04T00:00:00.0000000Z", "2017-01-05T00:00:00.0000000Z", "2017-01-06T00:00:00.0000000Z", "2017-01-07T00:00:00.0000000Z", "2017-01-08T00:00:00.0000000Z", "2017-01-09T00:00:00.0000000Z" ] |
When the input to make-series is empty, the default behavior of make-series produces an empty result.
let data=datatable(timestamp:datetime, metric: real)
[
  datetime(2016-12-31T06:00), 50,
  datetime(2017-01-01), 4,
  datetime(2017-01-02), 3,
  datetime(2017-01-03), 4,
  datetime(2017-01-03T03:00), 6,
  datetime(2017-01-05), 8,
  datetime(2017-01-05T13:40), 13,
  datetime(2017-01-06), 4,
  datetime(2017-01-07), 3,
  datetime(2017-01-08), 8,
  datetime(2017-01-08T21:00), 8,
  datetime(2017-01-09), 2,
  datetime(2017-01-09T12:00), 11,
  datetime(2017-01-10T05:00), 5,
];
let interval = 1d;
let stime = datetime(2017-01-01);
let etime = datetime(2017-01-10);
data
| take 0
| make-series avg(metric) default=1.0 on timestamp from stime to etime step interval
| count
Output
| Count |
|---|
| 0 |
Using kind=nonempty in make-series will produce a non-empty result of the default values:
let data=datatable(timestamp:datetime, metric: real)
[
  datetime(2016-12-31T06:00), 50,
  datetime(2017-01-01), 4,
  datetime(2017-01-02), 3,
  datetime(2017-01-03), 4,
  datetime(2017-01-03T03:00), 6,
  datetime(2017-01-05), 8,
  datetime(2017-01-05T13:40), 13,
  datetime(2017-01-06), 4,
  datetime(2017-01-07), 3,
  datetime(2017-01-08), 8,
  datetime(2017-01-08T21:00), 8,
  datetime(2017-01-09), 2,
  datetime(2017-01-09T12:00), 11,
  datetime(2017-01-10T05:00), 5,
];
let interval = 1d;
let stime = datetime(2017-01-01);
let etime = datetime(2017-01-10);
data
| take 0
| make-series kind=nonempty avg(metric) default=1.0 on timestamp from stime to etime step interval
Output
| avg_metric | timestamp |
|---|---|
| [ 1.0, 1.0, 1.0, 1.0, 1.0, 1.0, 1.0, 1.0, 1.0 ] |
[ "2017-01-01T00:00:00.0000000Z", "2017-01-02T00:00:00.0000000Z", "2017-01-03T00:00:00.0000000Z", "2017-01-04T00:00:00.0000000Z", "2017-01-05T00:00:00.0000000Z", "2017-01-06T00:00:00.0000000Z", "2017-01-07T00:00:00.0000000Z", "2017-01-08T00:00:00.0000000Z", "2017-01-09T00:00:00.0000000Z" ] |