Note
Access to this page requires authorization. You can try signing in or changing directories.
Access to this page requires authorization. You can try changing directories.
Switch services using the Version drop-down list. Learn more about navigation.
Applies to: ✅ Azure Data Explorer ✅ Azure Monitor ✅ Microsoft Sentinel
Applies two segments linear regression on a series, returning a dynamic object.
Takes an expression containing dynamic numerical array as input and applies two segments linear regression in order to identify and quantify trend changes in a series. The function iterates on the series indexes. In each iteration, it splits the series to two parts, and fits a separate line using series_fit_line() or series_fit_line_dynamic(). The function fits the lines to each of the two parts, and calculates the total R-squared value. The best split is the one that maximizes R-squared. The function returns its parameters in dynamic value with the following content:
rsquare: R-squared is a standard measure of the fit quality. It's a number in the range of [0-1], where 1 is the best possible fit, and 0 means the data is unordered and don't fit any line.split_idx: the index of breaking point to two segments (zero-based).variance: variance of the input data.rvariance: residual variance that is the variance between the input data values the approximated ones (by the two line segments).line_fit: numerical array holding a series of values of the best fitted line. The series length is equal to the length of the input array. It's used for charting.right.rsquare: r-square of the line on the right side of the split, see series_fit_line() or series_fit_line_dynamic().right.slope: slope of the right approximated line (of the form y=ax+b).right.interception: interception of the approximated left line (b from y=ax+b).right.variance: variance of the input data on the right side of the split.right.rvariance: residual variance of the input data on the right side of the split.left.rsquare: r-square of the line on the left side of the split, see [series_fit_line()].(series-fit-line-function.md) or series_fit_line_dynamic().left.slope: slope of the left approximated line (of the form y=ax+b).left.interception: interception of the approximated left line (of the form y=ax+b).left.variance: variance of the input data on the left side of the split.left.rvariance: residual variance of the input data on the left side of the split.
This operator is similar to series_fit_2lines. Unlike series-fit-2lines, it returns a dynamic bag.
Syntax
series_fit_2lines_dynamic(series)
Learn more about syntax conventions.
Parameters
| Name | Type | Required | Description |
|---|---|---|---|
| series | dynamic |
✔️ | An array of numeric values. |
Tip
The most convenient way of using this function is applying it to the results of the make-series operator.
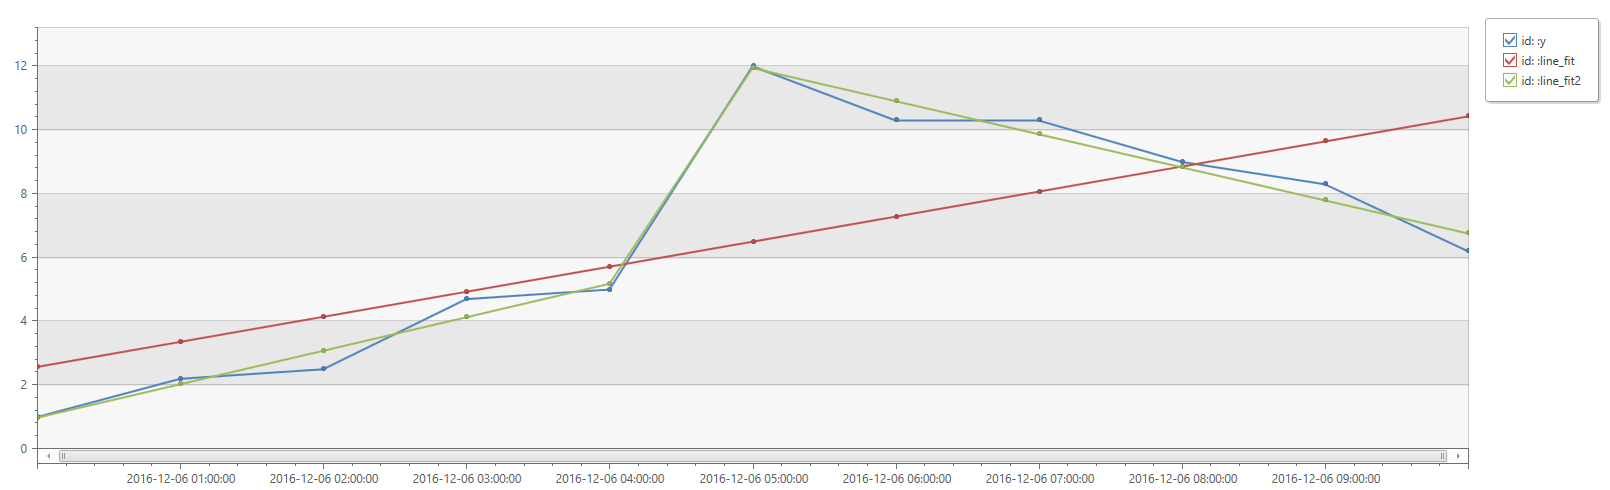
Example
print
    id=' ',
    x=range(bin(now(), 1h) - 11h, bin(now(), 1h), 1h),
    y=dynamic([1, 2.2, 2.5, 4.7, 5.0, 12, 10.3, 10.3, 9, 8.3, 6.2])
| extend
    LineFit=series_fit_line_dynamic(y).line_fit,
    LineFit2=series_fit_2lines_dynamic(y).line_fit
| project id, x, y, LineFit, LineFit2
| render timechart