Note
Access to this page requires authorization. You can try signing in or changing directories.
Access to this page requires authorization. You can try changing directories.
Applies to: ✅ Azure Data Explorer ✅ Azure Monitor ✅ Microsoft Sentinel
Applies linear regression on a series, returning dynamic object.
Takes an expression containing dynamic numerical array as input, and does linear regression to find the line that best fits it. This function should be used on time series arrays, fitting the output of make-series operator. It generates a dynamic value with the following content:
rsquare: r-square is a standard measure of the fit quality. It's a number in the range [0-1], where 1 is the best possible fit, and 0 means the data is unordered and doesn't fit any lineslope: Slope of the approximated line (the a-value from y=ax+b)variance: Variance of the input datarvariance: Residual variance that is the variance between the input data values and the approximated ones.interception: Interception of the approximated line (the b-value from y=ax+b)line_fit: Numerical array containing a series of values of the best fit line. The series length is equal to the length of the input array. It's used mainly for charting.
This operator is similar to series_fit_line, but unlike series-fit-line it returns a dynamic bag.
Syntax
series_fit_line_dynamic(series)
Learn more about syntax conventions.
Parameters
| Name | Type | Required | Description |
|---|---|---|---|
| series | dynamic |
✔️ | An array of numeric values. |
Tip
The most convenient way of using this function is by applying it to the results of make-series operator.
Examples
print
    id=' ',
    x=range(bin(now(), 1h) - 11h, bin(now(), 1h), 1h),
    y=dynamic([2, 5, 6, 8, 11, 15, 17, 18, 25, 26, 30, 30])
| extend fit=series_fit_line_dynamic(y)
| extend
    RSquare=fit.rsquare,
    Slope=fit.slope,
    Variance=fit.variance,
    RVariance=fit.rvariance,
    Interception=fit.interception,
    LineFit=fit.line_fit
| render timechart
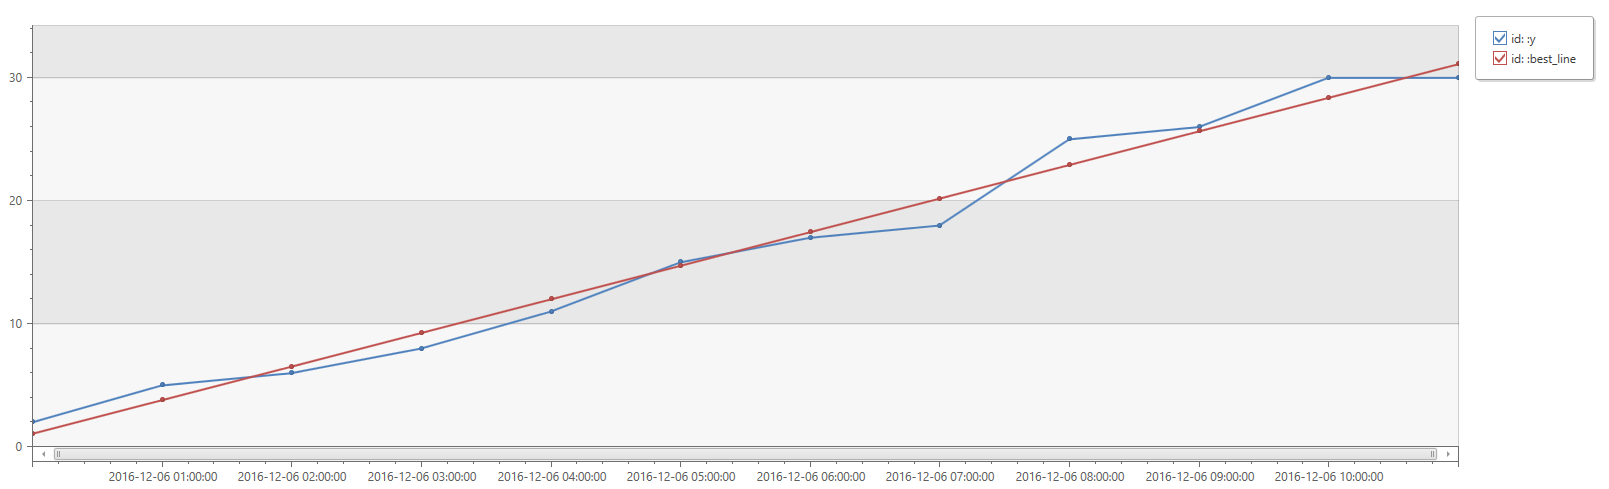
| RSquare | Slope | Variance | RVariance | Interception | LineFit |
|---|---|---|---|---|---|
| 0.982 | 2.730 | 98.628 | 1.686 | -1.666 | 1.064, 3.7945, 6.526, 9.256, 11.987, 14.718, 17.449, 20.180, 22.910, 25.641, 28.371, 31.102 |