Note
Access to this page requires authorization. You can try signing in or changing directories.
Access to this page requires authorization. You can try changing directories.
Applies to: ✅ Azure Data Explorer
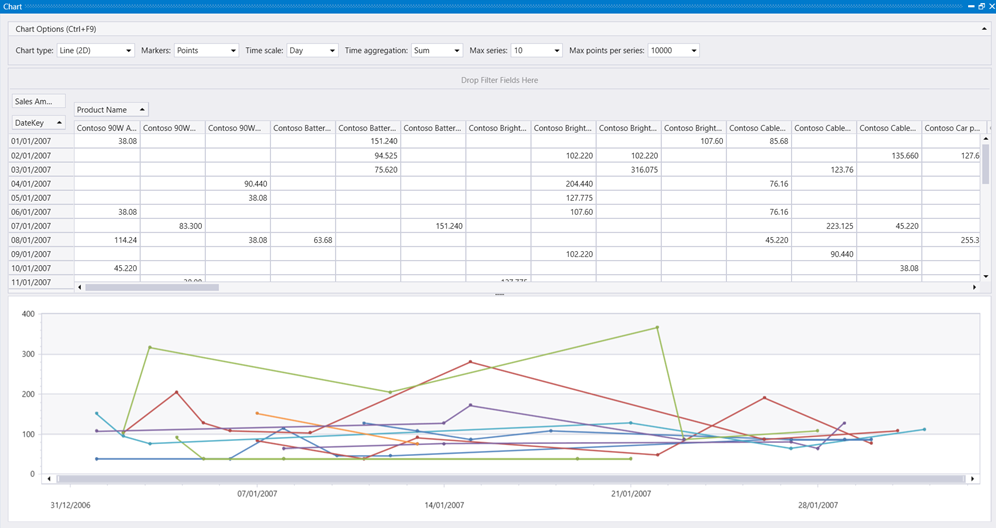
Displays a pivot table and chart. You can interactively select data, columns, rows, and various chart types.
Note
- This visualization can only be used in the context of the render operator.
- This visualization can be used in Kusto.Explorer but isn't available in the Azure Data Explorer web UI.
Syntax
T | render pivotchart
Learn more about syntax conventions.
Parameters
| Name | Type | Required | Description |
|---|---|---|---|
| T | string |
✔️ | Input table name. |
Example
This query provides a detailed analysis of sales for Contoso computer products within the specified date range, visualized as a pivot chart.
The examples in this article use publicly available tables in the help cluster, such as the
StormEventstable in the Samples database.
SalesFact
| join kind= inner Products on ProductKey
| where ProductCategoryName has "Computers" and ProductName has "Contoso"
| where DateKey between (datetime(2006-12-31) .. datetime(2007-02-01))
| project SalesAmount, ProductName, DateKey
| render pivotchart
Output
