Note
Access to this page requires authorization. You can try signing in or changing directories.
Access to this page requires authorization. You can try changing directories.
Switch services using the Version drop-down list. Learn more about navigation.
Applies to: ✅ Azure Data Explorer
Kusto.Explorer is a free Windows desktop tool. Use it to query and analyze data with Kusto Query Language (KQL) in a friendly interface. This article describes how to set up Kusto.Explorer and its user interface.
Use Kusto.Explorer to:
- Query your data
- Search your data across tables.
- Visualize your data in charts.
- Share queries and results by email or deep link.
Install Kusto.Explorer
Download and install Kusto.Explorer from:
Or use a ClickOnce-enabled browser to access your Kusto cluster at:
https://<your_cluster>/?web=0Replace the<your_cluster>placeholder with your cluster URI (for example,help.chinaeast2.kusto.chinacloudapi.cn).
Use Google Chrome with Kusto.Explorer
If Google Chrome is your default browser, install the ClickOnce extension.
If Microsoft Edge is your default browser, you don't need this extension. Check ClickOnce settings in Microsoft Edge flags.
Overview of the user interface
Kusto.Explorer uses tabs and panels:
- Use the menu panel to perform tasks.
- Manage connections in the connections panel.
- Create and run scripts in the script panel.
- View script results in the results panel.

Connections panel

The Connections panel lists all configured cluster connections. For each cluster, it lists databases, tables, and columns. Select an item to set context for the search or query in the main panel. To copy a name to the search or query panel, double-click the item.
If the schema is large (for example, a database with hundreds of tables), select Ctrl+F and enter a case-insensitive part of the entity name to search.
Control the Connections panel from the query window to support scripted workflows. Start the script with a command that tells Kusto.Explorer to connect to the cluster and database that the script queries:
#connect cluster('help').database('Samples')

StormEvents | count
Run each line with F5.
Work Documents pane

The Work folders pane organizes your work folders for quick navigation. It includes two types:
- Unsaved work: Folders for open query tabs you're still editing
- Tracked folders: Device folders you add as KQL libraries for easier access and management
Menu panel
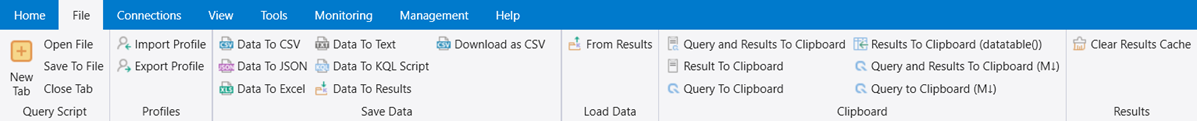
Home tab

The Home tab shows the most frequently used operations. It includes:
Query section

| Menu | Behavior |
|---|---|
| Mode dropdown |
|
| New Tab | Opens a new query tab for Kusto Query Language (KQL). |
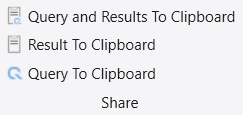
Share section
| Menu | Behavior |
|---|---|
| Data To Clipboard | Copies the query and dataset to the clipboard. If a chart is shown, also copies the chart as a bitmap. |
| Result To Clipboard | Copies the dataset to the clipboard. If a chart is shown, also copies the chart as a bitmap. |
| Query to Clipboard | Copies the query to the clipboard. |
Visualizations section
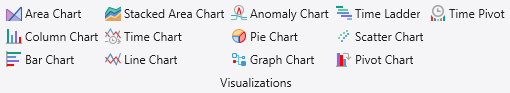
For more visualization options, see the render operator.
| Menu | Behavior |
|---|---|
| Area chart | Shows an area chart where the first column (numeric) is the X-axis. Maps each numeric column to a separate Y-axis series. |
| Column Chart | Shows a column chart where all numeric columns are mapped to different series (Y-axis). The text column before numeric is the X-axis (can be controlled in the UI). |
| Bar Chart | Shows a bar chart where all numeric columns are mapped to different series (X-axis). The text column before numeric is the Y-axis (can be controlled in the UI). |
| Stacked Area Chart | Shows a stacked area chart in which the X-axis is the first column (must be numeric). All numeric columns are mapped to different series (Y-axis). |
| Time Chart | Shows a time chart in which the X-axis is the first column (must be datetime). All numeric columns are mapped to different series (Y-axis). |
| Line Chart | Shows a line chart in which the X-axis is the first column (must be numeric). All numeric columns are mapped to different series (Y-axis). |
| Anomaly Chart | Similar to Time Chart but detects anomalies in time series data by using a machine learning algorithm. Data must use fixed interval buckets. For anomaly detection, Kusto.Explorer uses the series_decompose_anomalies function. |
| Pie Chart | Shows a pie chart in which the color axis is the first column. The theta axis (must be a measure, converted to percent) is the second column. |
| Time Ladder | Shows a ladder chart in which the X-axis is the last two columns (must be datetime). The Y-axis is a composite of the other columns. |
| Scatter Chart | Shows a point graph in which the X-axis is the first column (must be numeric). All numeric columns are mapped to different series (Y-axis). |
| Pivot Chart | Shows a pivot table and chart that lets you select data, columns, rows, and chart types. |
| Time Pivot | Lets you navigate the event timeline interactively (pivots on the time axis). |
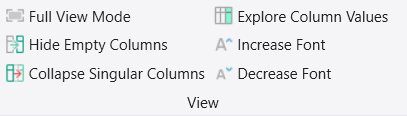
View section
| Menu | Behavior |
|---|---|
| Full View Mode | Maximizes the workspace by hiding the ribbon menu and Connection Panel. Exit Full View Mode by selecting Home > Full View Mode, or by pressing F11. |
| Hide Empty Columns | Removes empty columns from the data grid. |
| Collapse Singular Columns | Collapses columns with singular values. |
| Explore Column Values | Shows the distribution of column values. |
| Increase Font | Increases font size in the query tab and results grid. |
| Decrease Font | Decreases font size in the query tab and results grid. |
Note
Data view settings:
Kusto.Explorer tracks settings for each unique set of columns. When you reorder or remove columns, it saves the data view and reuses it when you retrieve data with the same columns. To reset the view to its defaults, on the View tab, select Reset View.
File tab
| Menu | Behavior |
|---|---|
| Query script | |
| New Tab | Opens a new tab window for querying Kusto. |
| Open File | Loads a .kql script into the active query pane. |
| Save To File | Saves the active script to a .kql file. |
| Close Tab | Closes the current tab. |
| Profiles | |
| Import Profile | Imports a Kusto.Explorer profile. |
| Export Profile | Exports a Kusto.Explorer profile. |
| Save data | |
| Data To CSV | Exports data to a CSV (comma-separated-values) file. |
| Data To JSON | Exports data to a JSON formatted file. |
| Data To Excel | Exports data to an XLSX (Excel) file. |
| Data To Text | Exports data to a TXT (text) file. |
| Data To KQL Script | Exports the query to a script file. |
| Data To Results | Exports the query and data to a results (QRES) file. |
| Run Query Into CSV | Runs the query and saves the results to a local CSV file. |
| Load data | |
| From Results | Loads the query and data from a results (QRES) file. |
| Clipboard | |
| Query and Results To Clipboard | Copies the query and dataset to the clipboard. If a chart is shown, copies the chart as a bitmap. |
| Result To Clipboard | Copies the dataset to the clipboard. If a chart is shown, copies the chart as a bitmap. |
| Query To Clipboard | Copies the query to the clipboard. |
| Results To Clipboard (datatable()) | Copies the query results to the clipboard. The maximum allowed cell value is 30,000. |
| Results | |
| Clear results cache | Clears cached results of previously run queries. |
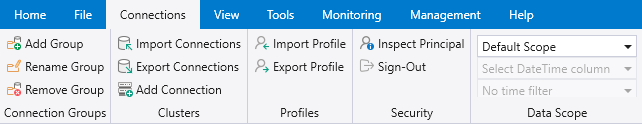
Connections tab
| Menu | Behavior |
|---|---|
| Groups | |
| Add Group | Add a Kusto server group. |
| Clusters | |
| Import Connections | Import connections from a file. |
| Export Connections | Export connections to a file. |
| Add Connection | Add a Kusto server connection. |
| Edit Connection | Open the connection properties dialog. |
| Remove Connection | Remove the Kusto server connection. |
| Refresh | Refresh the connection properties. |
| Profiles | |
| Import Profile | Import a Kusto.Explorer profile. |
| Export Profile | Export a Kusto.Explorer profile. |
| Security | |
| Inspect Your ADD Principal | Show current signed-in user details. |
| Sign-out | Sign out the current user from Microsoft Entra ID. |
| Data scope | |
| Caching scope |
|
| DateTime Column | Name of a column you can use for a time prefilter. |
| Time Filter | Value of the time prefilter. |
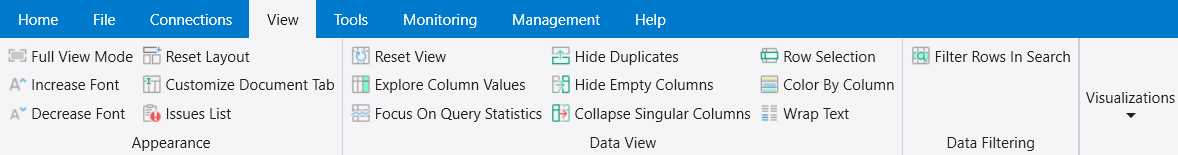
View tab
| Menu | Behavior |
|---|---|
| Appearance | |
| Full View Mode | Maximizes the work space by hiding the ribbon menu and Connection Panel. Exit Full View Mode by selecting Home > Full View Mode, or by pressing **F11 . |
| Increase Font | Increases the font size of the query tab and of the results data grid. |
| Decrease Font | Decreases the font size of the query tab and of the results data grid. |
| Reset Layout | Resets the docking layout and windows. |
| Rename Document Tab | Renames the selected tab. |
| Data View | |
| Reset View | Resets the data view settings to their defaults. |
| Explore Column Values | Shows the distribution of column values. |
| Focus on Query Statistics | Shows query statistics instead of results when the query finishes. |
| Hide Duplicates | Toggles removal of duplicate rows from results. |
| Hide Empty Columns | Removes empty columns from the results. |
| Collapse Singular Columns | Collapses columns that contain a single value. |
| Row Selection | Enables selecting specific rows in the Results panel. |
| Color By Column | Colors identical values in the first column. |
| Wrap Text | Wraps cell content to fit the column width. |
| Data Filtering | |
| Filter Rows In Search | Toggles showing only matching rows when you search ( Ctrl+F ). |
| Visualizations | |
| Visualizations | See Visualizations. |
Note
Kusto.Explorer tracks settings per unique set of columns. When you reorder or remove columns, it saves the data view and reuses it when it retrieves data with the same columns. To reset to defaults, in the View tab, select Reset View.
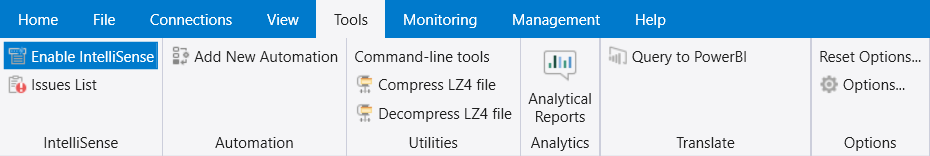
Tools tab
| Menu | Behavior |
|---|---|
| IntelliSense | |
| Enable IntelliSense | Enables or disables IntelliSense in the Script panel. |
| Issues List | Lists issues in the Script panel. |
| Automation | |
| Add New Automation | Generates a report with query insights. |
| Utilities | |
| Command-line tools | Opens a command prompt. |
| Compress LZ4 file | Compresses files with the LZ4 algorithm. |
| Decompress LZ4 file | Decompresses files with the LZ4 algorithm. |
| Analytics | |
| Analytical Reports | Opens a dashboard with prebuilt data analysis reports. |
| Translate | |
| Query to Power BI | Converts a query to a Power BI format. |
| Query to WPA | Converts a query to a WPA format. |
| Query to WPA (Clipboard) | Converts a query to a WPA format and copies it to the clipboard. |
| Options | |
| Reset Options | Resets app settings to default values. |
| Options | Opens the options tool to configure app settings. For details, see Kusto.Explorer options. |
Table row colors
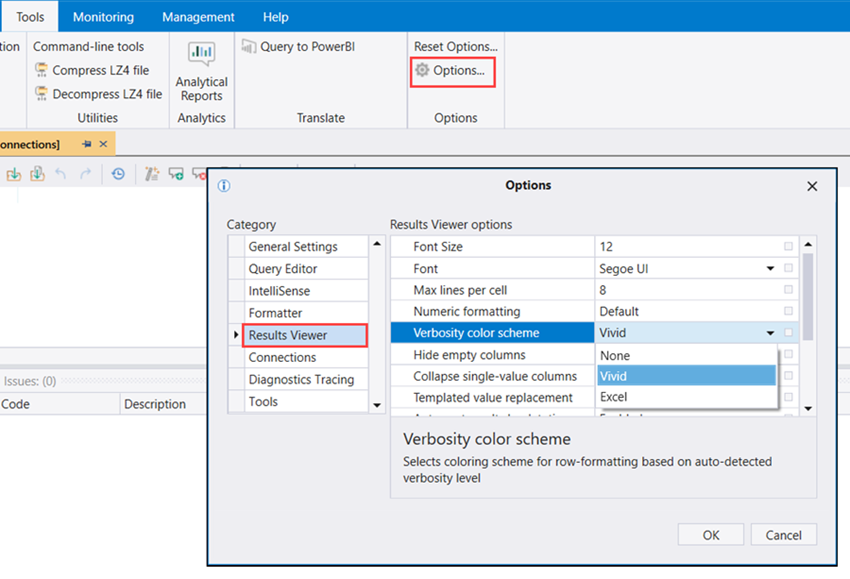
Kusto.Explorer interprets each row's severity or verbosity level in the results panel and colors rows accordingly. It matches distinct column values to known patterns (for example, "Warning", "Error").
To change the output color scheme or turn off this behavior, select Tools > Options > Results Viewer > Verbosity color scheme.
| Excel color scheme legend | Vivid color scheme legend |
|---|---|
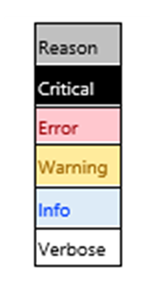
|
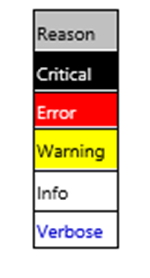
|
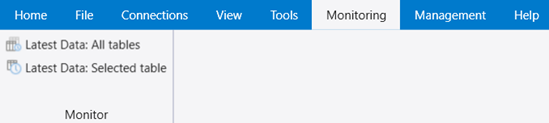
Monitoring tab
| Menu | Behavior |
|---|---|
| Monitor | |
| Cluster Diagnostics | Shows a health summary for the Server Group currently selected in Connections Panel. |
| Latest data: All tables | Shows a summary of the latest data in all tables of the currently selected database. |
| Latest data: Selected table | Shows the latest data for the selected table in the status bar. |
Management tab
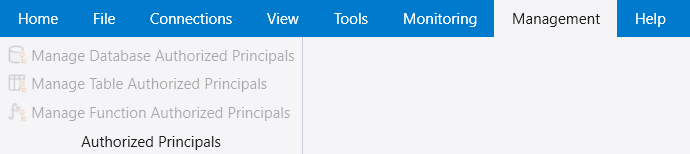
| Menu | Behavior |
|---|---|
| Authorized Principals | |
| Manage Database Authorized Principals | Lets authorized users manage database principals. |
| Manage Table Authorized Principals | Lets authorized users manage table principals. |
| Manage Function Authorized Principals | Lets authorized users manage function principals. |
Help tab
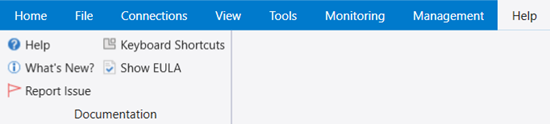
| Menu | Behavior |
|---|---|
| Documentation | |
| Help | Opens the Kusto online documentation. |
| What's new | Opens the Kusto.Explorer release notes. |
| Keyboard Shortcuts | Opens the Kusto.Explorer keyboard shortcuts. |
| Show EULA | Opens the Azure Legal Information article. |
| Support and Feedback | |
| Issue Report | Opens a dialog with two options: . |
| Suggest Feature | Opens a page to share your ideas. |
| Kusto Support (KAI Bot) | Opens KAI for self-service, proactive guidance, and autonomous troubleshooting. |
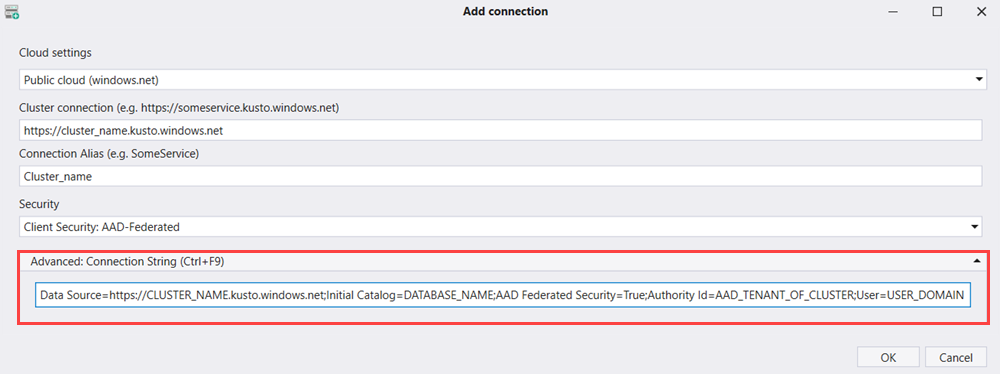
Control the user identity connecting to Kusto.Explorer
The default security model for new connections is Microsoft Entra ID federated security. Authentication uses Microsoft Entra ID with the default Microsoft Entra sign-in experience.
For finer control over authentication parameters, expand the Advanced: Connection Strings box and enter a valid Kusto connection string.
For example, users in multiple Microsoft Entra tenants sometimes need to select a specific identity in a target tenant. Use the connection string to specify it. Replace the placeholder values in angle brackets with your own values:
Data Source=https://<ClusterName>.kusto.chinacloudapi.cn;Initial Catalog=<DatabaseName>;AAD Federated Security=True;Authority Id=<TenantId>;User=<UserIdentity>
<TenantId>is the domain name or Microsoft Entra tenant ID (a GUID) of the tenant that hosts the cluster (for example, contoso.com).<UserIdentity>is the user identity invited into that tenant (for example, user@example.com).
Note
The user's domain name might differ from the tenant that hosts the cluster.