Note
Access to this page requires authorization. You can try signing in or changing directories.
Access to this page requires authorization. You can try changing directories.
Azure Data Explorer is a fast and highly scalable data exploration service for log and telemetry data. Power BI is a business analytics solution that lets you visualize your data and share the results across your organization.
Azure Data Explorer provides three options for connecting to data in Power BI: use the built-in connector, import a query from Azure Data Explorer, or use a SQL query. This article shows you how to use a SQL query to get data and visualize it in a Power BI report.
If you don't have an Azure subscription, create a Azure account before you begin.
Prerequisites
You need the following to complete this article:
- A Microsoft account or a Microsoft Entra user identity to sign in to the help cluster.
- Power BI Desktop
Get data from Azure Data Explorer
First, you connect to the Azure Data Explorer help cluster, then you bring in a subset of the data from the StormEvents table. The StormEvents sample dataset contains weather-related data from the National Centers for Environmental Information.
You typically use the native query language with Azure Data Explorer, but it also supports SQL queries, which you'll use here. Azure Data Explorer translates the SQL query into a native query for you.
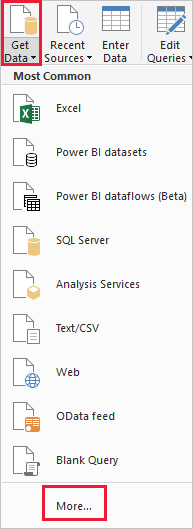
In Power BI Desktop, on the Home tab, select Get Data then More.
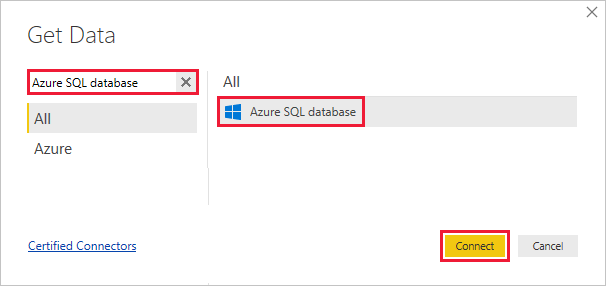
Search for Azure SQL Database, select Azure SQL Database then Connect.
On the SQL Server database screen, fill out the form with the following information.
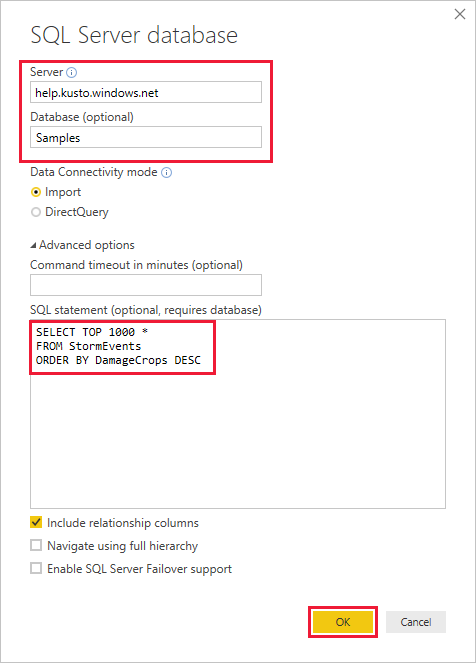
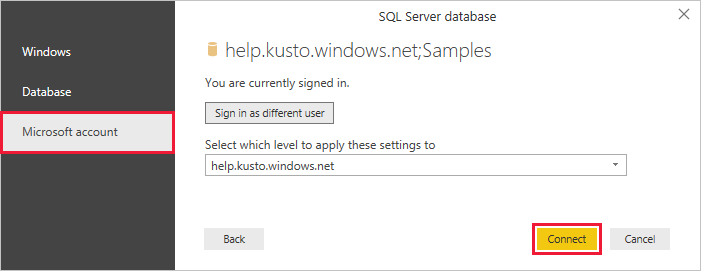
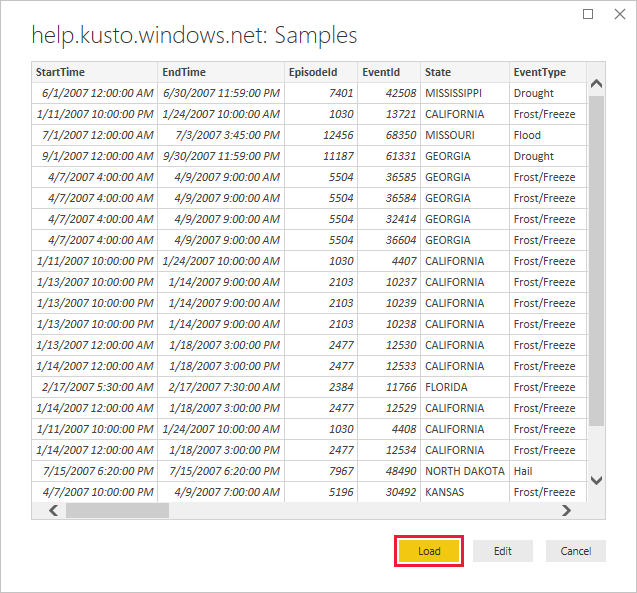
Setting Value Field description Server help.chinaeast2.kusto.chinacloudapi.cn The URL for the help cluster (without https://). For other clusters, the URL is in the form <ClusterName>.<Region>.kusto.chinacloudapi.cn. Database Samples The sample database that is hosted on the cluster you're connecting to. Data connectivity mode Import Determines whether Power BI imports the data or connects directly to the data source. You can use either option with this connector. Command timeout Leave blank How long the query runs before it throws a timeout error. SQL statement Copy the query below this table The SQL statement that Azure Data Explorer translates into a native query. Other options Leave as default values Options don't apply to Azure Data Explorer clusters. SELECT TOP 1000 * FROM StormEvents ORDER BY DamageCrops DESCIf you don't already have a connection to the help cluster, sign in. Sign in with a Microsoft account, then select Connect.
On the help.chinaeast2.kusto.chinacloudapi.cn: Samples screen, select Load.
The table opens in the main Power BI window, in report view, where you can create reports based on the sample data.
Visualize data in a report
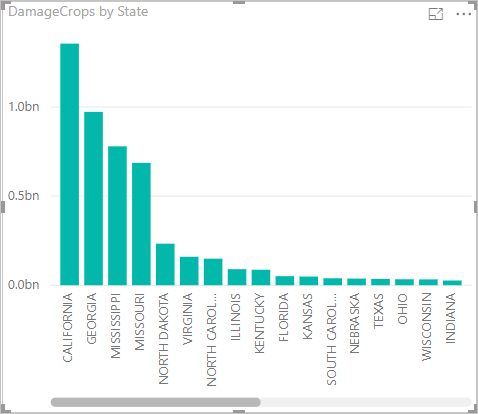
Now that you have data in Power BI Desktop, you can create reports based on that data. You'll create a simple report with a column chart that shows crop damage by state.
On the left side of the main Power BI window, select the report view.

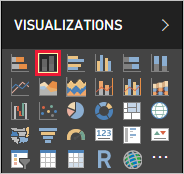
In the VISUALIZATIONS pane, select the clustered column chart.
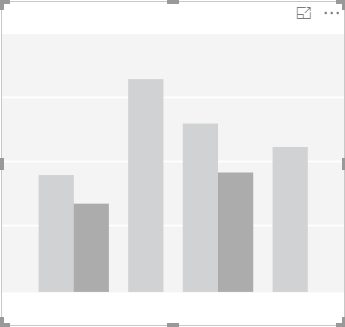
A blank chart is added to the canvas.
In the FIELDS list, select DamageCrops and State.
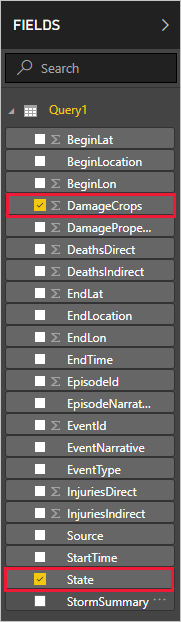
You now have a chart that shows the damage to crops for the top 1000 rows in the table.
Save the report.
Clean up resources
If you no longer need the report you created for this article, delete the Power BI Desktop (.pbix) file.