Note
Access to this page requires authorization. You can try signing in or changing directories.
Access to this page requires authorization. You can try changing directories.
Azure Data Explorer (ADX) is a fully managed analytics platform for real-time analysis of large-scale telemetry and log data. This article explains how cost per GB ingested is calculated in Azure Data Explorer, what factors drive it, and how you can optimize your cluster for cost efficiency. Big data analytics platforms use different pricing models. Many platforms base pricing on factors like query volume, data ingestion, storage duration, and compute resources. This complexity makes it hard to compare pricing across products.
To help understand the cost of using Azure Data Explorer, this article uses the metric cost per GB ingested. This metric is the total cluster cost (compute, storage, networking, and service markup) divided by the total original sized data ingested during that period.
A representative snapshot of ADX clusters in June 2025 is used to ground the example analysis. The following sections show the main results from the analysis, explain what drives the cost variations, and how users can optimize cost per GB ingested without compromising performance.
Note
- All cost figures in this article show list prices and don't include discounts or commitment-based savings.
- For the purpose of this example analysis, cost per GB is expressed in Sample Cost Units (SCUs), where each SCU represents a generic cost unit, for example, one US cent.
Cost per GB ingested analysis
The chart below shows median daily GB ingested in original size (Y-axis) vs. median cost per GB ingested (X-axis) for each cost group. Bubble size represents the group’s share of total data ingested into the service.
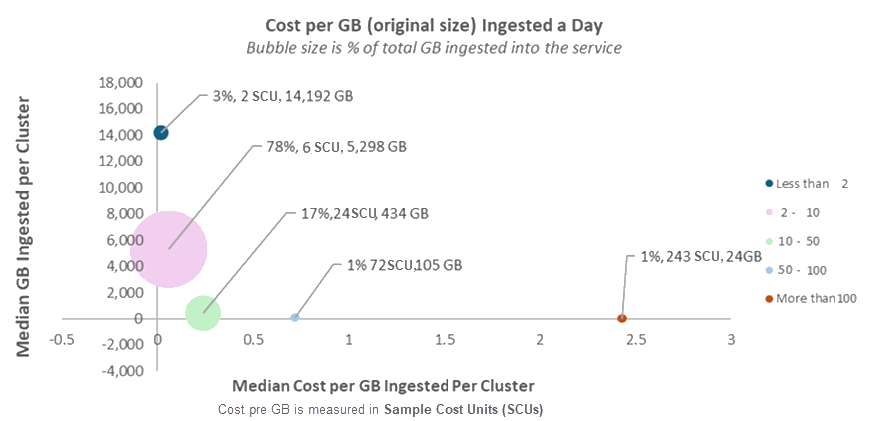
Cost per GB ingested varies across clusters, but several patterns stand out:
Most data (>75%) is ingested at a cost between 2 and 10 SCUs per GB (before discounts).
Less than 5% of the data is ingested at less than 2 SCUs per GB.
Even within the same usage category (or "bubble"), you see significant variation. For example, in the largest bubble, one cluster ingests at 2 SCUs per GB, while another reaches 10 SCUs per GB. That's a 5X difference. The next sections explain the key reasons for this variation.
Clusters with higher cost per GB are less common and usually have lower ingestion volumes. In general, smaller data volumes mean higher cost per GB.
Important
The bubble graph shows that cost per GB ingested varies across clusters. This variation doesn't indicate good or bad practices. It reflects different scenarios, configurations, and usage patterns for the service.
For example, one cluster might retain data longer for compliance, which increases storage costs. Another might use update policies that process data during ingestion, which raises compute usage. These scenarios are intentional design choices aligned with specific goals, and they naturally affect cost per GB.
What drives cost per GB ingested
These key factors are behind the variations in cost per GB ingested per cluster:
Storage duration: The longer you store data, the higher the cost. See retention policy.
High CPU usage: Actions like heavy queries, data processing, or transformations cause high CPU usage.
Cache settings: Caching more data boosts performance but can increase costs. See cache policy.
Cold data usage: Queries that access cold data trigger read transactions and add to cost. See hot and cold cache.
Data transformation and optimization: Features like Update Policies, Materialized Views, and Partitioning consume CPU resources and can raise cost. See Update policies, Materialized views, and partitions.
Ingestion volume: Clusters operate more cost-effectively at higher ingestion volumes.
Streaming vs. Queued ingestion: Each has a different cost profile depending on the use case. See streaming and Queued.
Schema design: Wide tables with many columns need more compute and storage resources, which raises costs.
Advanced features: Options like followers, private endpoints, and Python sandboxes consume more resources and can add to cost.
Data pipeline choice: Some ingestion paths cost less. For example, Event Grid ingestion is usually cheaper than Event Hubs.
Autoscale: Clusters without autoscale often cost more because they don't adjust their size based on demand.
You can configure most of these factors to optimize both performance and cost.
A closer look at key cost drivers
This section explores the key factors that influence the cost per GB ingested in Azure Data Explorer, providing insights into how you can manage and optimize these costs.
Data retention impact on cost
In ADX, all ingested data is stored in persistent storage. Each table and materialized view has a retention policy that defines how long the data is kept. The longer the data is retained, the higher the cost, based on Azure Storage pricing. When you need long-term storage, like for compliance, the cost per GB ingested increases because it includes ongoing storage expense.
In addition to the extent size reported by the cluster, there are two additional cost drivers:
- Retention buffer: An extra 7 days of data is stored by default to protect against accidental data loss.
- Recoverability overhead: For tables where the recoverability setting is enabled (default), data is retained for an additional 14 days. This includes intermediate blobs generated during merge and rebuild operations.
Cluster size
Cluster size is the number of machines (nodes) in the cluster. Each machine adds cost, depending on its type (SKU). Autoscale adjusts the cluster size based on CPU usage, so the system can optimize cost and performance by avoiding idle or redundant resources.
Autoscale adjusts the cluster size to ensure cached data fits within the available SSD space. As a result, a large cache can increase cluster size and if CPU usage is low, this may lead to a higher cost per GB. See the Cache tab Clusters Insight tool for more information on optimizing the cache size.
Clusters that run many queries or do CPU-heavy tasks like Materialized Views, Update Policies, or Partitioning can scale the cluster, raising the cost per GB. Note that these features can significantly increase query performance and reduce query CPU usage and thus improve overall efficiency.
Volume of data ingested
As a cluster grows, more nodes are added, increasing total cost. That cost is spread across all ingested data, so the more data you ingest, the lower the cost per GB.
Cold data usage
When queries frequently access cold data stored on disk, they cause read transactions that use more resources and can increase overall cluster cost.
Streaming vs. queued Ingestion
Each ingestion method has different cost, latency, and functionality characteristics, so each is better for different scenarios. For cost, streaming ingestion is cheaper when you ingest many small tables with trickling data, while queued ingestion is more cost-effective for large tables.
Tip
Optimize Cost per GB Ingested
Check the configurations of the key cost drivers to ensure they fit your cluster’s needs and service requirements for efficiency. In particular:
- Minimize queries over cold data to reduce read transactions.
- Enable autoscale to dynamically match cluster size to demand.