Note
Access to this page requires authorization. You can try signing in or changing directories.
Access to this page requires authorization. You can try changing directories.
Azure Monitor collects and aggregates metrics and logs from your system to monitor availability, performance, and resilience, and notify you of issues affecting your system. You can use the Azure portal, PowerShell, Azure CLI, REST API, or client libraries to set up and view monitoring data.
Different metrics and logs are available for different resource types. This article describes the types of monitoring data you can collect for this service and ways to analyze that data.
Collect data with Azure Monitor
This table describes how you can collect data to monitor your service, and what you can do with the data once collected:
| Data to collect | Description | How to collect and route the data | Where to view the data | Supported data |
|---|---|---|---|---|
| Metric data | Metrics are numerical values that describe an aspect of a system at a particular point in time. Aggregate metrics by using algorithms, compare metrics to other metrics, and analyze metrics for trends over time. | - Collected automatically at regular intervals. - You can route some platform metrics to a Log Analytics workspace to query with other data. Check the DS export setting for each metric to see if you can use a diagnostic setting to route the metric data. |
Metrics explorer | Azure Data Explorer metrics supported by Azure Monitor |
| Resource log data | Logs are recorded system events with a timestamp. Logs can contain different types of data, and be structured or free-form text. You can route resource log data to Log Analytics workspaces for querying and analysis. | Create a diagnostic setting to collect and route resource log data. | Log Analytics | Azure Data Explorer resource log data supported by Azure Monitor |
| Activity log data | The Azure Monitor activity log provides insight into subscription-level events. The activity log includes information like when a resource is modified or a virtual machine is started. | - Collected automatically. - Create a diagnostic setting to a Log Analytics workspace at no charge. |
Activity log |
For the list of all of the data supported by Azure Monitor, see:
Built-in monitoring for Azure Data Explorer
Azure Data Explorer offers metrics and logs to monitor the service.
Monitor Azure Data Explorer performance, health, and usage by using metrics
Azure Data Explorer metrics provide key indicators about the health and performance of the Azure Data Explorer cluster resources. Use the metrics to monitor Azure Data Explorer cluster usage, health, and performance in your specific scenario as standalone metrics. You can also use metrics as the basis for operational Azure Dashboards and Azure Alerts.
To use metrics to monitor your Azure Data Explorer resources in the Azure portal:
- Sign in to the Azure portal.
- In the left-hand pane of your Azure Data Explorer cluster, search for metrics.
- Select Metrics to open the metrics pane and begin analysis on your cluster.
In the metrics pane, select specific metrics to track, choose how to aggregate your data, and create metric charts to view on your dashboard.
The Resource and Metric Namespace pickers are preselected for your Azure Data Explorer cluster. The numbers in the following image correspond to the numbered list. They guide you through different options in setting up and viewing your metrics.

- To create a metric chart, select Metric name and relevant Aggregation per metric. For more information about different metrics, see supported Azure Data Explorer metrics.
- Select Add metric to see multiple metrics plotted in the same chart.
- Select + New chart to see multiple charts in one view.
- Use the time picker to change the time range (default: past 24 hours).
- Use Add filter and Apply splitting for metrics that have dimensions.
- Select Pin to dashboard to add your chart configuration to the dashboards so that you can view it again.
- Set New alert rule to visualize your metrics by using the set criteria. The new alerting rule includes your target resource, metric, splitting, and filter dimensions from your chart. Modify these settings in the alert rule creation pane.
Monitor Azure Data Explorer ingestion, commands, queries, and tables using diagnostic logs
Azure Data Explorer is a fast, fully managed data analytics service for real-time analysis on large volumes of data streaming from applications, websites, IoT devices, and more. Azure Monitor resource logs provide data about the operation of Azure resources. Azure Data Explorer uses diagnostic logs for insights on ingestion, commands, query, and tables. You can export operation logs to Azure Storage, event hub, or Log Analytics to monitor ingestion, commands, and query status. Logs from Azure Storage and Azure Event Hubs can be routed to a table in your Azure Data Explorer cluster for further analysis.
Important
Diagnostic log data might contain sensitive data. Restrict permissions of the logs destination according to your monitoring needs.
Note
In the Azure portal, the raw metrics data for the Metrics and Insights pages are stored in Azure Monitor. The queries on these pages query the raw metrics data directly to provide the most accurate results. When using the diagnostics settings feature, you can migrate the raw metrics data to the Log Analytics workspace. During the migration, some data precision may be lost due to rounding; hence, query results may vary slightly from the original data. The margin for error is less than one percent.
You can use diagnostic logs to configure the collection of the following log data:
Note
- Ingestion logs support queued ingestion to the Data ingestion URI by using Kusto client libraries and data connectors.
- Ingestion logs don't support streaming ingestion, direct ingestion to the Cluster URI, ingestion from query, or
.set-or-appendcommands.
Note
Failed ingestion logs report only the final state of an ingest operation, unlike the Ingestion result metric, which is emitted for transient failures that are retried internally.
- Successful ingestion operations: These logs contain information about successfully completed ingestion operations.
- Failed ingestion operations: These logs contain detailed information about failed ingestion operations, including error details.
- Ingestion batching operations: These logs contain detailed statistics of batches ready for ingestion, such as duration, batch size, blobs count, and batching types).
You can send the log data to a Log Analytics workspace, a storage account, or stream it to an event hub.
Diagnostic logs are disabled by default. Use the following steps to enable diagnostic logs for your cluster:
In the Azure portal, select the cluster resource that you want to monitor.
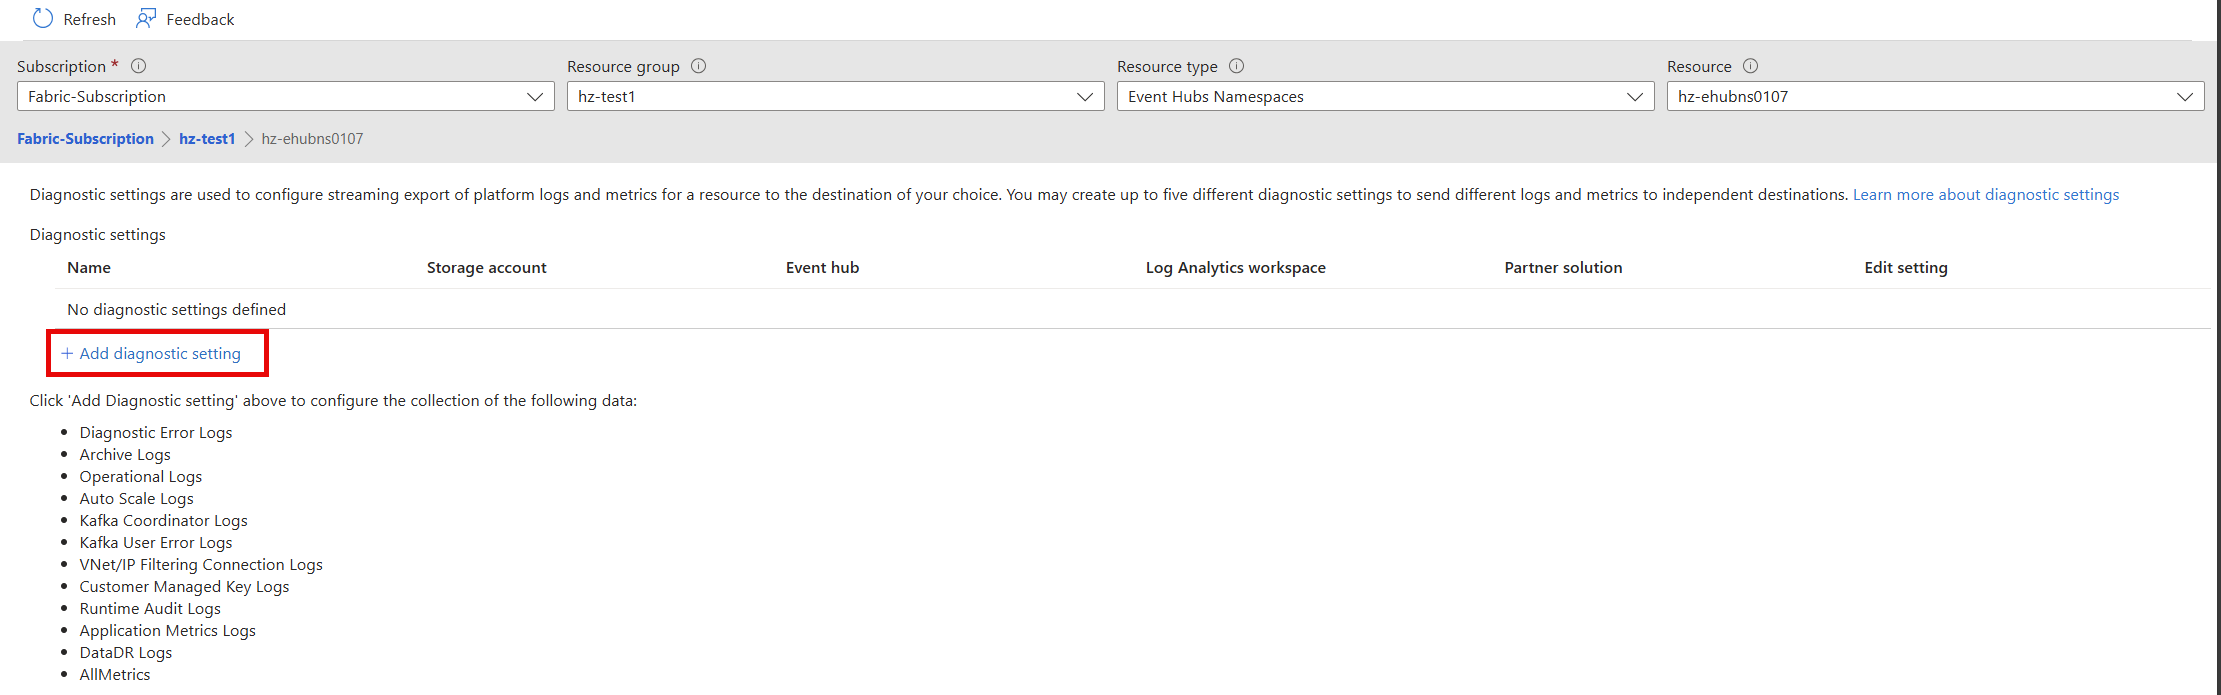
Under Monitoring, select Diagnostic settings.
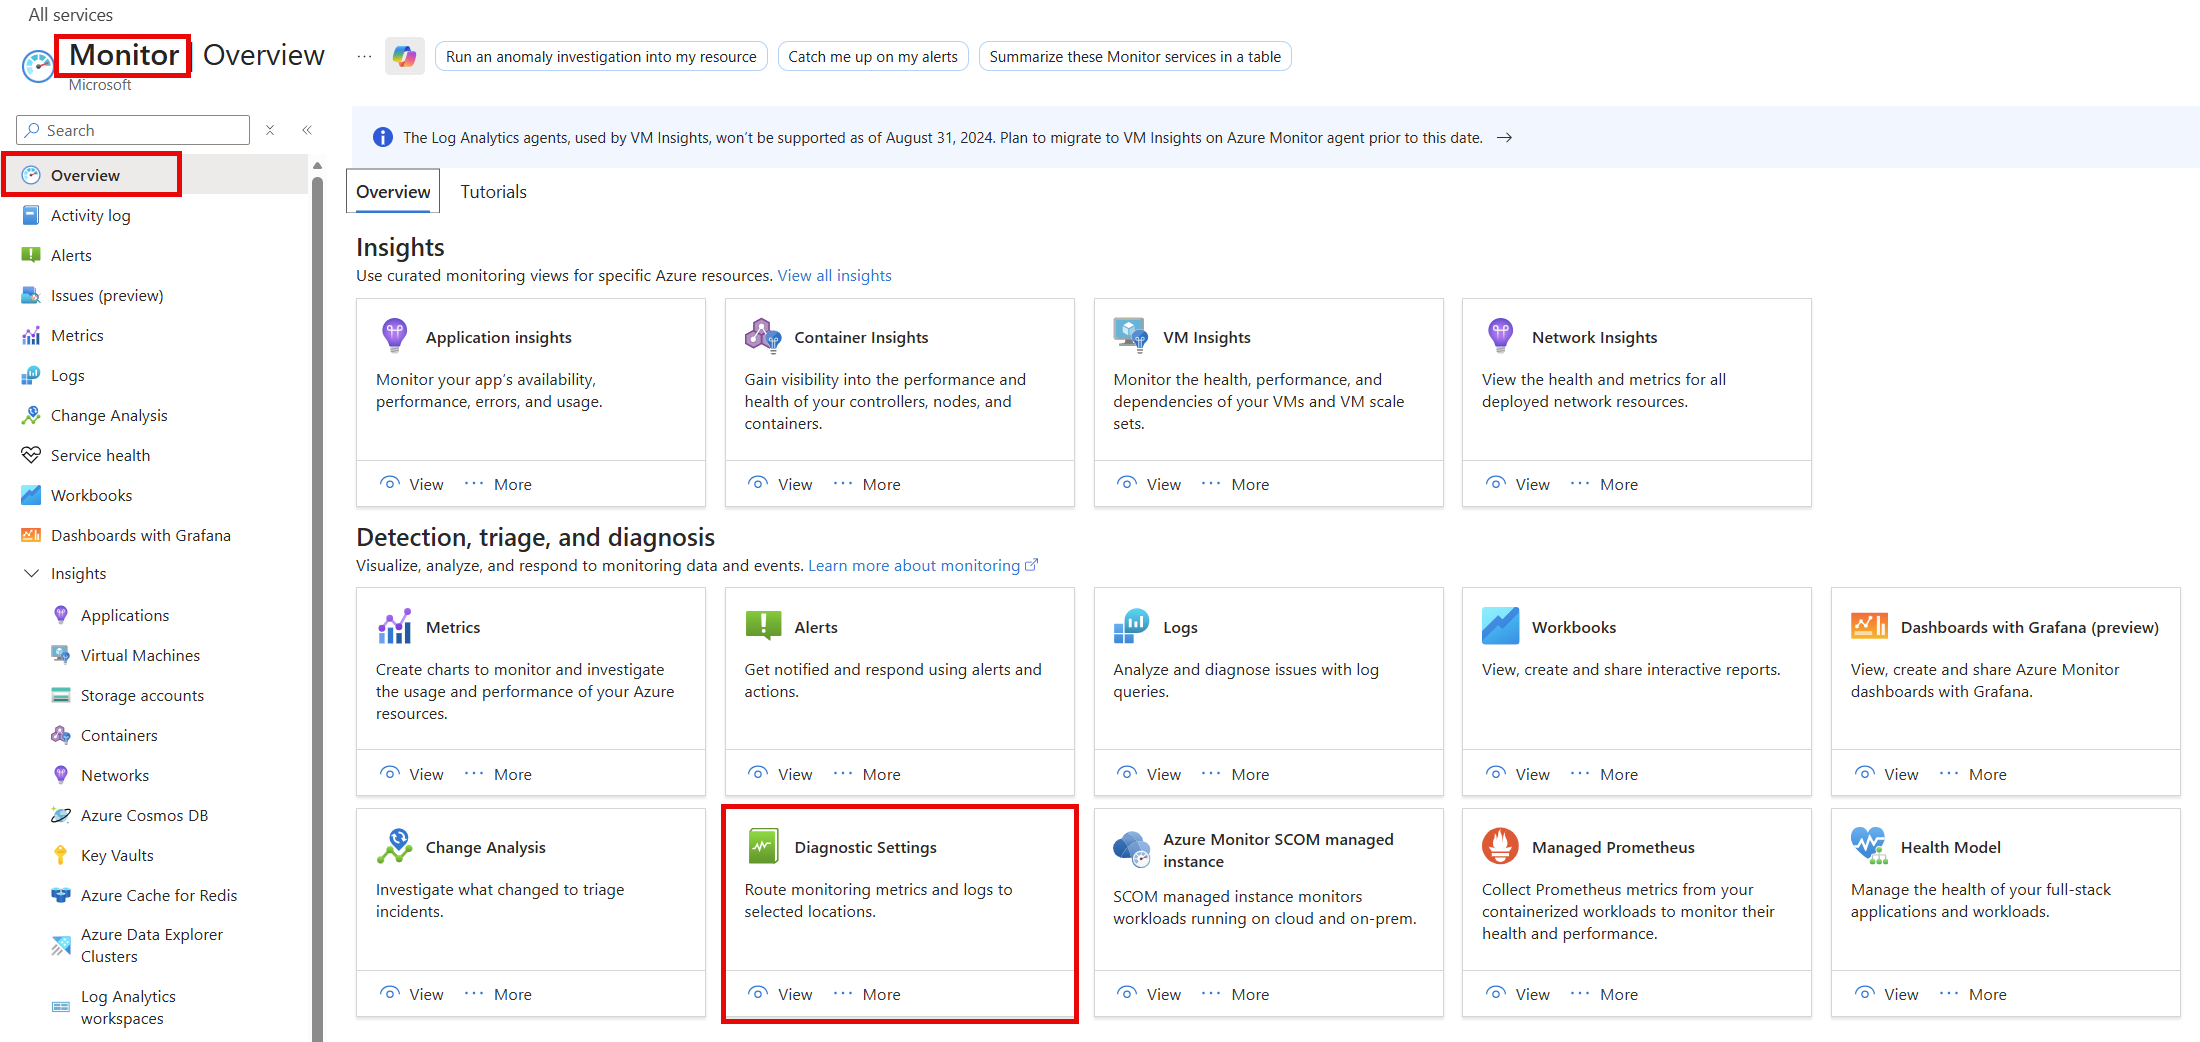
Select Add diagnostic setting.
In the Diagnostic settings window:
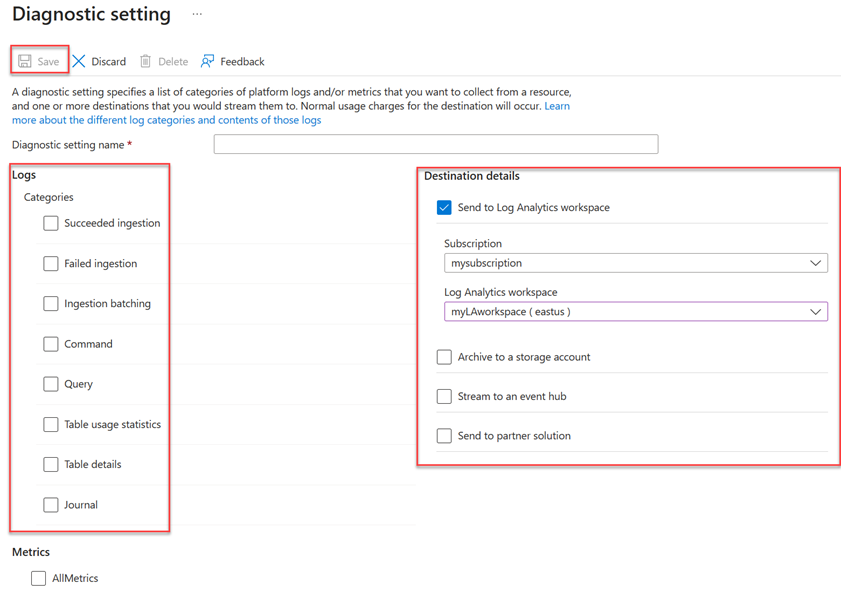
- Enter a Diagnostic setting name.
- Select one or more destination targets: a Log Analytics workspace, a storage account, or an event hub.
- Select logs to collect: Succeeded ingestion, Failed ingestion, Ingestion batching, Command, Query, Table usage statistics, Table details, or Journal.
- Select metrics to collect (optional).
- Select Save to save the new diagnostic logs settings and metrics.


After you create the settings, logs start to appear in the configured destination targets: a storage account, an event hub, or Log Analytics workspace.
Note
If you send logs to a Log Analytics workspace, the SucceededIngestion, FailedIngestion, IngestionBatching, Command, Query, TableUsageStatistics, TableDetails, and Journal logs are stored in Log Analytics tables named: SucceededIngestion, FailedIngestion, ADXIngestionBatching, ADXCommand, ADXQuery, ADXTableUsageStatistics, ADXTableDetails, and ADXJournal respectively.
Use Azure Monitor tools to analyze the data
These Azure Monitor tools are available in the Azure portal to help you analyze monitoring data:
Some Azure services have a built-in monitoring dashboard in the Azure portal. These dashboards are called insights, and you can find them in the Insights section of Azure Monitor in the Azure portal.
Metrics explorer allows you to view and analyze metrics for Azure resources. For more information, see Analyze metrics with Azure Monitor metrics explorer.
Log Analytics allows you to query and analyze log data using the Kusto query language (KQL). For more information, see Get started with log queries in Azure Monitor.
The Azure portal has a user interface for viewing and basic searches of the activity log. To do more in-depth analysis, route the data to Azure Monitor logs and run more complex queries in Log Analytics.
Application Insights monitors the availability, performance, and usage of your web applications, so you can identify and diagnose errors without waiting for a user to report them.
Application Insights includes connection points to various development tools and integrates with Visual Studio to support your DevOps processes. For more information, see Application monitoring for App Service.
Tools that allow more complex visualization include:
- Dashboards that let you combine different kinds of data into a single pane in the Azure portal.
- Workbooks, customizable reports that you can create in the Azure portal. Workbooks can include text, metrics, and log queries.
- Grafana, an open platform tool that excels in operational dashboards. You can use Grafana to create dashboards that include data from multiple sources other than Azure Monitor.
- Power BI, a business analytics service that provides interactive visualizations across various data sources. You can configure Power BI to automatically import log data from Azure Monitor to take advantage of these visualizations.
Export Azure Monitor data
You can export data out of Azure Monitor into other tools using:
Metrics: Use the REST API for metrics to extract metric data from the Azure Monitor metrics database. For more information, see Azure Monitor REST API reference.
Logs: Use the REST API or the associated client libraries.
To get started with the Azure Monitor REST API, see Azure monitoring REST API walkthrough.
Use Kusto queries to analyze log data
You can analyze Azure Monitor Log data using the Kusto query language (KQL). For more information, see Log queries in Azure Monitor.
Use Azure Monitor alerts to notify you of issues
Azure Monitor alerts allow you to identify and address issues in your system, and proactively notify you when specific conditions are found in your monitoring data before your customers notice them. You can alert on any metric or log data source in the Azure Monitor data platform. There are different types of Azure Monitor alerts depending on the services you're monitoring and the monitoring data you're collecting. See Choosing the right type of alert rule.
For examples of common alerts for Azure resources, see Sample log alert queries.
Implementing alerts at scale
For some services, you can monitor at scale by applying the same metric alert rule to multiple resources of the same type that exist in the same Azure region. Azure Monitor Baseline Alerts (AMBA) provides a semi-automated method of implementing important platform metric alerts, dashboards, and guidelines at scale.
Get personalized recommendations using Azure Advisor
For some services, if critical conditions or imminent changes occur during resource operations, an alert displays on the service Overview page in the portal. You can find more information and recommended fixes for the alert in Advisor recommendations under Monitoring in the left menu. During normal operations, no advisor recommendations display.
For more information on Azure Advisor, see Azure Advisor overview.