Note
Access to this page requires authorization. You can try signing in or changing directories.
Access to this page requires authorization. You can try changing directories.
Important
This feature is in Public Preview. You can confirm preview enrollment on the Previews page. See Manage Azure Databricks previews.
This article has sample queries that workspace admins can use to monitor activity associated with dashboards. All queries access the audit logs table, which is a system table that stores records for all audit events from workspaces in your region.
For a comprehensive reference of available audit log services and events, see Diagnostic log reference.
Monitor draft and published dashboards
The examples in this section demonstrate how to retrieve audit logs for common questions about dashboard activity.
How many dashboards were created in the past week?
The following query returns the number of dashboards that were created in your workspace over the past week.
SELECT
  action_name,
  COUNT(action_name) as num_dashboards
FROM
  system.access.audit
WHERE
  action_name = "createDashboard"
  AND event_date >= current_date() - interval 7 days
GROUP BY
  action_name
The following image shows example query results:

What are the dashboard IDs associated with the most popular dashboards?
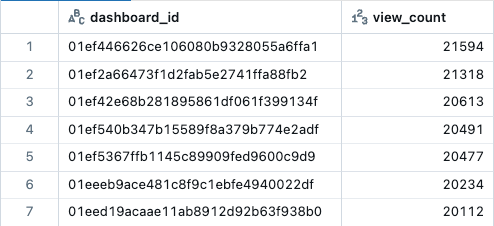
Most examples in this article focus on auditing activity on a specific dashboard. You can use audit logs to retrieve specific dashboard IDs. The following query retrieves dashboards with the most views by counting the getDashboard and getPublishedDashboard actions associated with the IDs.
SELECT
  request_params.dashboard_id as dashboard_id,
  COUNT(*) AS view_count
FROM
  system.access.audit
WHERE
  action_name in ("getDashboard", "getPublishedDashboard")
GROUP BY
  dashboard_id
ORDER BY
  view_count DESC
The following image shows example query results:

How many times was this dashboard viewed in the past week?
The following query uses a specific dashboard_id to show the number of times the dashboard was viewed in the past week. The action_name column shows whether the draft or published dashboard was accessed. getPublishedDashboard refers to views of the published dashboard. getDashboard refers to views of the draft dashboard. When you run the query, substitute <dashboard_id> with the UUID string associated with a dashboard in your workspace.
SELECT
  action_name,
  COUNT(action_name) as view_count
FROM
  system.access.audit
WHERE
  request_params.dashboard_id = "<dashboard_id>"
  AND event_date >= current_date() - interval 7 days
  AND action_name in ("getDashboard", "getPublishedDashboard")
GROUP BY action_name
The following image shows example query results:

What's the number of views by user in the past day?
The following query identifies the number of times a viewer has accessed a dashboard in the past day. The results include whether the user accessed the published dashboard (getPublishedDashboard) or the draft dashboard (getDashboard).
SELECT
  user_identity.email as username,
  COUNT(user_identity.email) as num_views,
  action_name
FROM
  system.access.audit
WHERE
  service_name = 'dashboards'
AND action_name in ('getDashboard', 'getPublishedDashboard')
AND event_time > now() - interval '1 day'
GROUP BY username, action_name
The following image shows example query results:

Who were the top viewers in the past week?
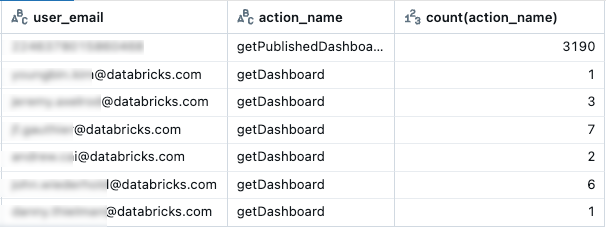
The following query identifies the users who view a specific dashboard most frequently in the past week. It also shows whether those views were on draft or published dashboards. For this query, the dashboard ID is provided as a parameter. To learn more about using dashboard parameters, see Work with dashboard parameters.
SELECT
  user_identity.email as user_email,
  action_name,
  COUNT(action_name) as view_count
FROM
  system.access.audit
WHERE
  request_params.dashboard_id = :dashboard_id
  AND event_date >= current_date() - interval 7 days
  AND action_name in ("getDashboard", "getPublishedDashboard")
GROUP BY action_name, user_email
The following image shows example query results:

Monitor embedded dashboards
You can monitor activity on embedded dashboards using the audit logs for workspace events. To learn about other workspace events that appear in the audit log, see Workspace events.
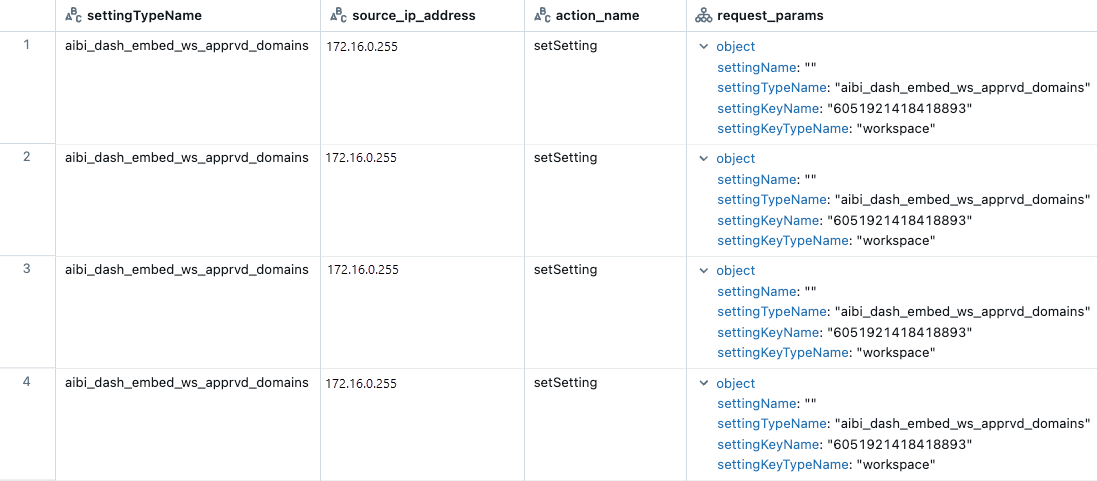
The following query retrieves details for dashboards that have been embedded in external websites or applications.
SELECT
  request_params.settingTypeName,
  source_ip_address,
  user_identity.email,
  action_name,
  request_params
FROM
  system.access.audit
WHERE
  request_params.settingTypeName ilike "aibi%"
The following image shows example query results:

Set up alerts
You can set alerts to automate this type of monitoring. See Create an alert to learn how to set an alert on a specific threshold.