Note
Access to this page requires authorization. You can try signing in or changing directories.
Access to this page requires authorization. You can try changing directories.
Important
Attention: All Microsoft Defender for Cloud features will be officially retired in Azure in China region on August 18, 2026 per the announcement posted by 21Vianet.
Microsoft Defender for Cloud provides continuous export of security data. This feature allows you to stream security data to Log Analytics in Azure Monitor, to Azure Event Hubs, or to another Security Information and Event Management (SIEM), Security Orchestration Automated Response (SOAR), or IT classic deployment model solution. You can analyze and visualize the data using Azure Monitor logs and other Azure Monitor features.
When you set up continuous export, you can fully customize what information to export and where the information goes. For example, you can configure it so that:
- All high-severity alerts are sent to an Azure event hub.
- All medium or higher-severity findings from vulnerability assessment scans of your computers running SQL Server are sent to a specific Log Analytics workspace.
- Specific recommendations are delivered to an event hub or Log Analytics workspace whenever they're generated.
- The secure score for a subscription is sent to a Log Analytics workspace whenever the score for a control changes by 0.01 or more.
What data types can be exported?
You can use continuous export to export the following data types whenever they change:
- Security recommendations.
- Recommendation severity.
- Security findings.
- Secure score.
- Controls.
- Security alerts.
- Regulatory compliance.
Recommendation severity, security findings, and controls are sub categories that belong to a parent category. For example:
- The recommendations System updates should be installed on your machines (powered by Update Center) and System updates should be installed on your machines each has one sub recommendation per outstanding system update.
- The recommendation Machines should have vulnerability findings resolved has a sub recommendation for every vulnerability that the vulnerability scanner identifies.
Note
If you’re configuring continuous export by using the REST API, always include the parent with the findings.
Export data to an event hub or Log Analytics workspace in another tenant
You can't configure data to be exported to a Log Analytics workspace in another tenant if you use Azure Policy to assign the configuration. This process works only when you use the REST API to assign the configuration, and the configuration is unsupported in the Azure portal (because it requires a multitenant context). Azure Lighthouse doesn't resolve this issue with Azure Policy, although you can use Azure Lighthouse as the authentication method.
When you collect data in a tenant, you can analyze the data from one, central location.
To export data to an event hub or Log Analytics workspace in a different tenant:
In the tenant that has the event hub or Log Analytics workspace, invite a user from the tenant that hosts the continuous export configuration, or you can configure Azure Lighthouse for the source and destination tenant.
If you use business-to-business (B2B) guest user access in Microsoft Entra ID, ensure that the user accepts the invitation to access the tenant as a guest.
If you use a Log Analytics workspace, assign the user in the workspace tenant one of these roles: Owner, Contributor, Log Analytics Contributor, Microsoft Sentinel Contributor, or Monitoring Contributor.
Create and submit the request to the Azure REST API to configure the required resources. You must manage the bearer tokens in both the context of the local (workspace) tenant and the remote (continuous export) tenant.
Export to a Log Analytics workspace
If you want to analyze Microsoft Defender for Cloud data inside a Log Analytics workspace or use Azure alerts together with Defender for Cloud alerts, set up continuous export to your Log Analytics workspace.
Log Analytics tables and schemas
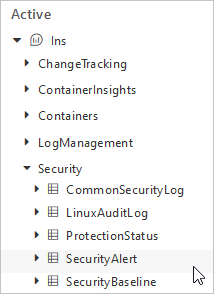
Security alerts and recommendations are stored in the SecurityAlert and SecurityRecommendation tables respectively.
The name of the Log Analytics solution that contains these tables depends on whether you enabled the enhanced security features: Security (the Security and Audit solution) or SecurityCenterFree.
Tip
To see the data on the destination workspace, you must enable one of these solutions: Security and Audit or SecurityCenterFree.

To view the event schemas of the exported data types, see Log Analytics table schemas.