Note
Access to this page requires authorization. You can try signing in or changing directories.
Access to this page requires authorization. You can try changing directories.
Important
Attention: All Microsoft Defender for Cloud features will be officially retired in Azure in China region on August 18, 2026 per the announcement posted by 21Vianet.
After you've set up continuous export of Microsoft Defender for Cloud security alerts and recommendations, you can view the data in Azure Monitor. This article describes how to view the data in Log Analytics or in Azure Event Hubs and create alert rules in Azure Monitor based on that data.
Prerequisites
Before you begin, setup continuous export with one of these methods:
- Setup continuous export in the Azure portal
- Setup continuous export with Azure Policy
- Setup continuous export with REST API.
View exported data in Log Analytics
When you export Defender for Cloud data to a Log Analytics workspace, two main tables are created automatically:
SecurityAlertSecurityRecommendation
You can query these tables in Log Analytics to confirm that continuous export is working.
Sign in to the Azure portal.
Search for and select Log Analytics workspaces.
Select the workspace that you configured as your continuous export target.
In the workspace menu, select Logs.
In the query window, enter one of the following queries and select Run:
SecurityAlertor
SecurityRecommendation
View exported data in Azure Event Hubs
When you export data to Azure Event Hubs, Defender for Cloud continuously streams alerts and recommendations as event messages. You can view these exported events in the Azure portal and analyze them further by connecting a downstream service.
Sign in to the Azure portal.
Search for and select Event Hubs namespaces.
Select the namespace and event hub that you configured for continuous export.
In the event hub menu, select Metrics to view message activity, or Process data > Capture to review event contents stored in your capture destination.
Optionally, use a connected tool such as Microsoft Sentinel, a SIEM, or a custom consumer app to read and process the exported events.
Note
Defender for Cloud sends data in JSON format. You can use Event Hubs Capture or consumer groups to store and analyze the exported events.
Create alert rules in Azure Monitor (optional)
You can create Azure Monitor alerts based on your exported Defender for Cloud data. These alerts let you automatically trigger actions, such as sending email notifications or creating ITSM tickets, when specific security events occur.
Sign in to the Azure portal.
Search for and select Monitor.
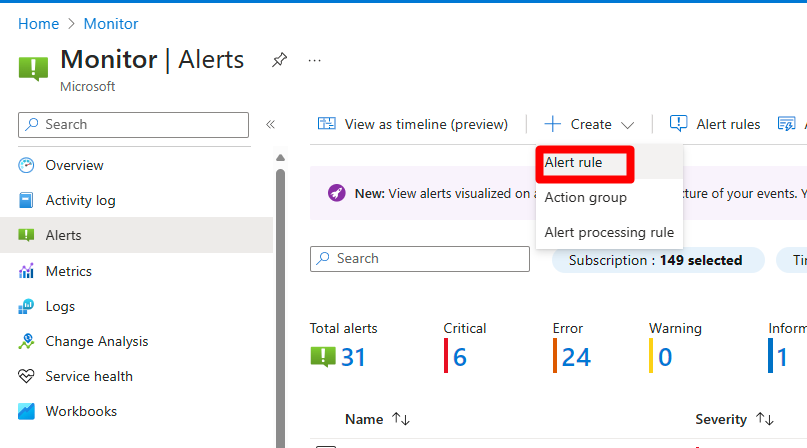
Select Alerts.
Select + Create > Alert rule.
Set up your new rule the same way you'd configure a log alert rule in Azure Monitor:
- For Resource types, select the Log Analytics workspace to which you exported security alerts and recommendations.
- For Condition, select Custom log search. In the page that appears, configure the query, lookback period, and frequency period. In the query, enter SecurityAlert or SecurityRecommendation.
- Optionally, create an action group to trigger. Action groups can automate sending an email, creating an ITSM ticket, running a webhook, and more, based on an event in your environment.
After you save the rule, Defender for Cloud alerts or recommendations appear in Azure Monitor based on your continuous export configuration and alert rule conditions. If you’ve linked an action group, it triggers automatically when the rule criteria are met.
