Note
Access to this page requires authorization. You can try signing in or changing directories.
Access to this page requires authorization. You can try changing directories.
This article describes how to use the portal to see metrics for Event Grid topics and subscriptions, and create alerts on them.
Important
For a list of metrics supported Azure Event Grid, see Metrics.
View custom topic metrics
If you've published a custom topic, you can view the metrics for it.
Sign in to Azure portal.
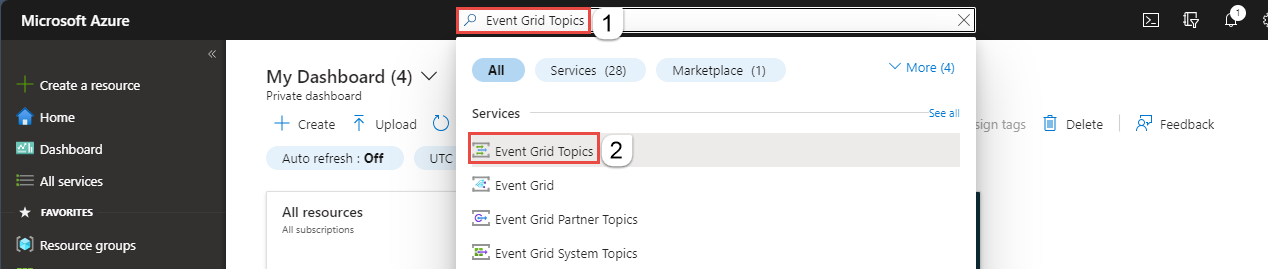
In the search bar at the topic, type Event Grid Topics, and then select Event Grid Topics from the drop-down list.
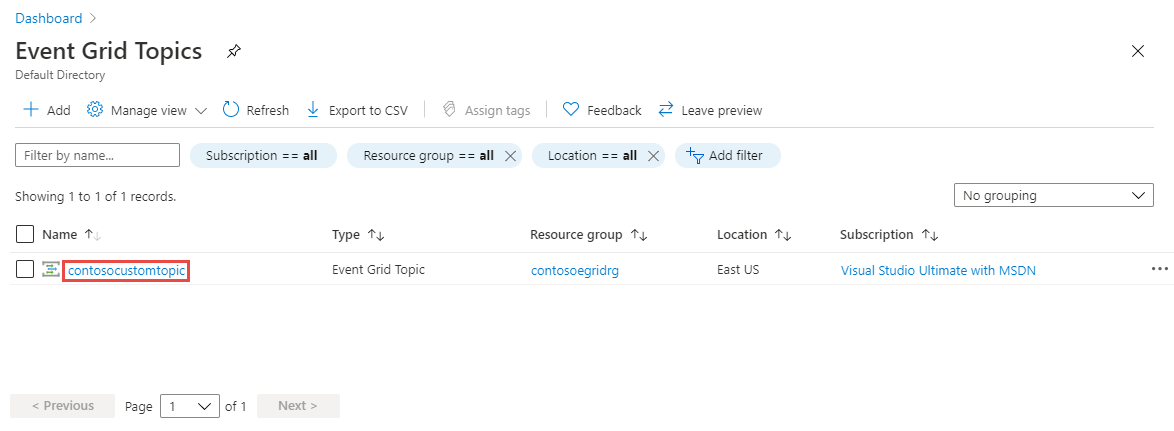
Select your custom topic from the list of topics.
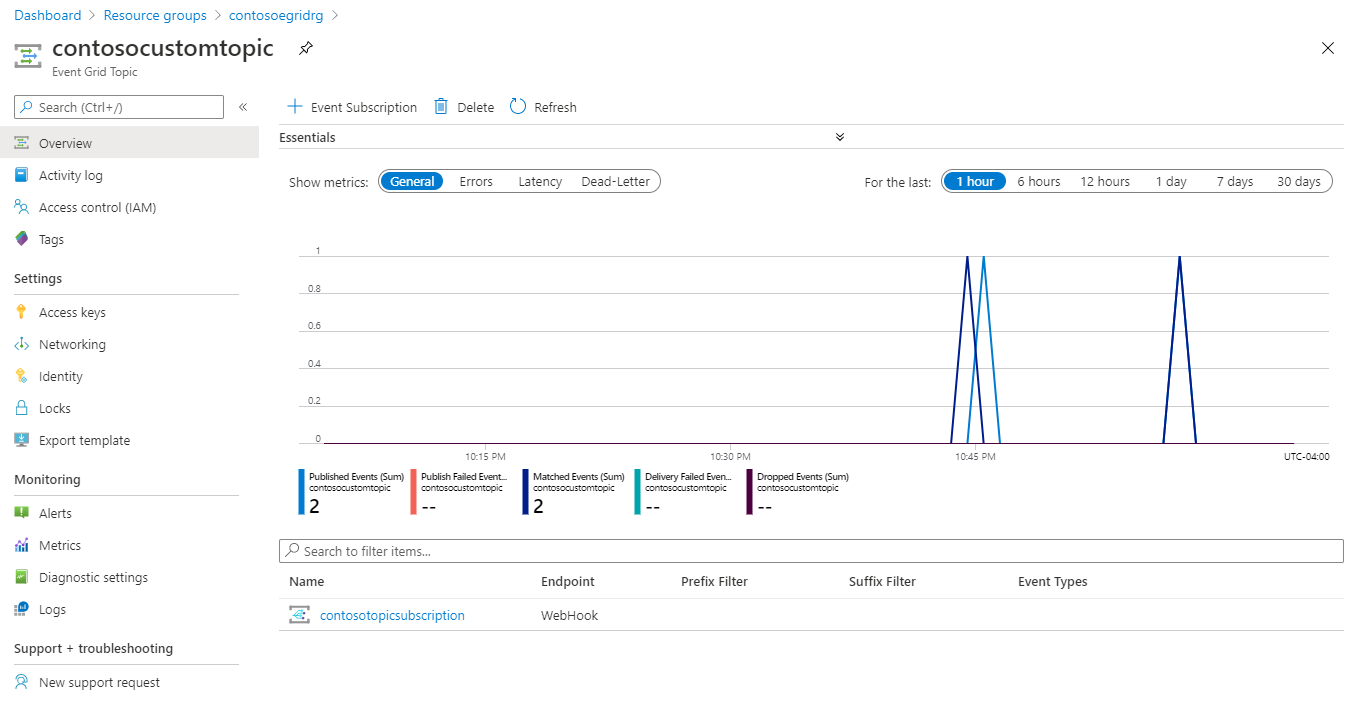
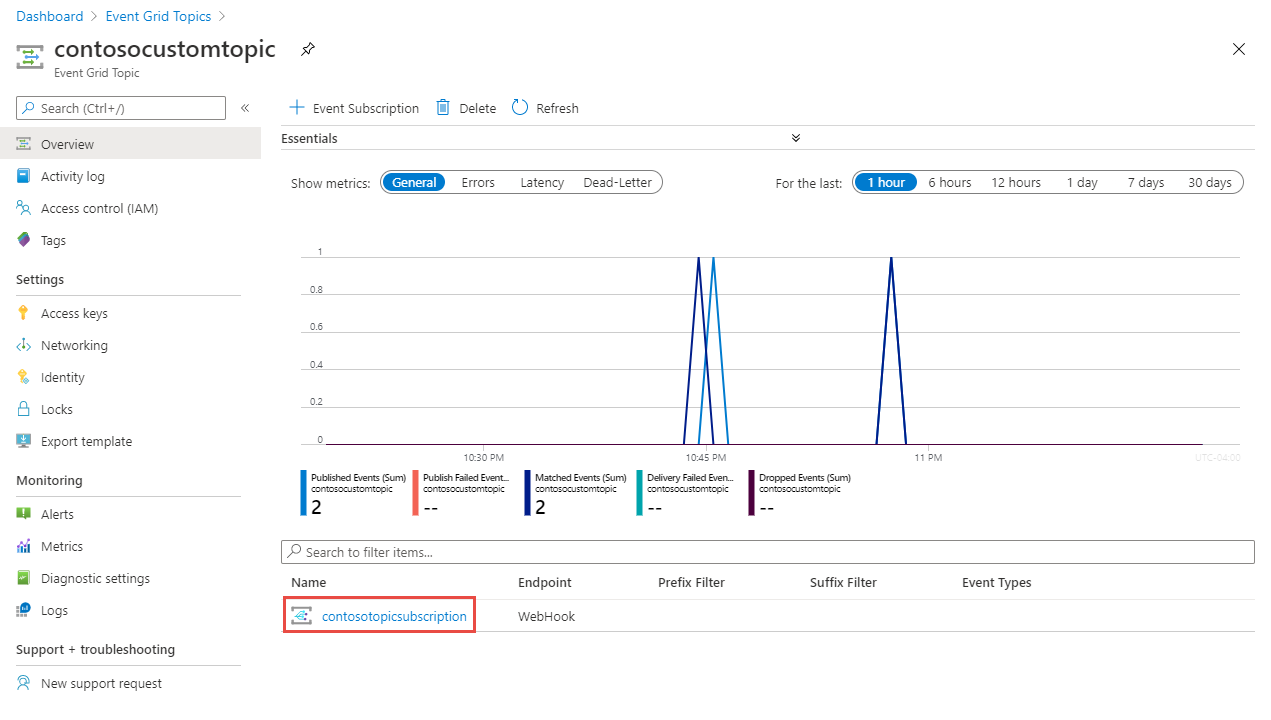
View the metrics for the custom event topic on the Event Grid Topic page. In the following image, the Essentials section that shows the resource group, subscription etc. is minimized.
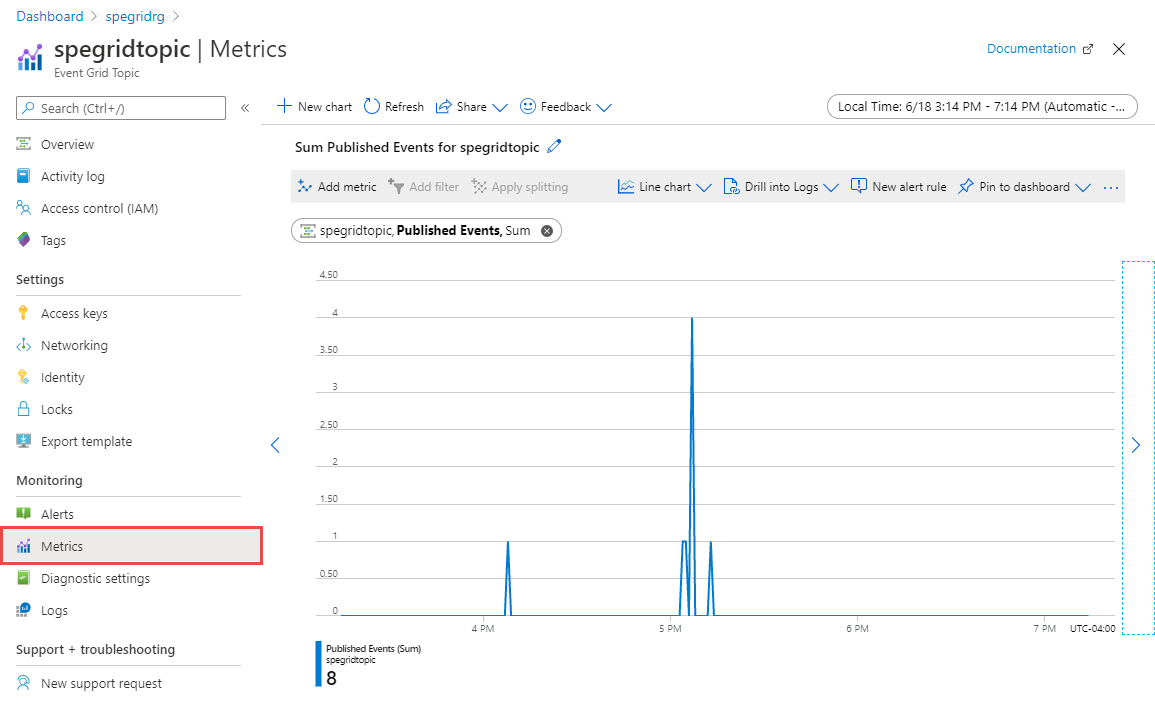
You can create charts with supported metrics by using the Metrics tab of the Event Grid Topic page.
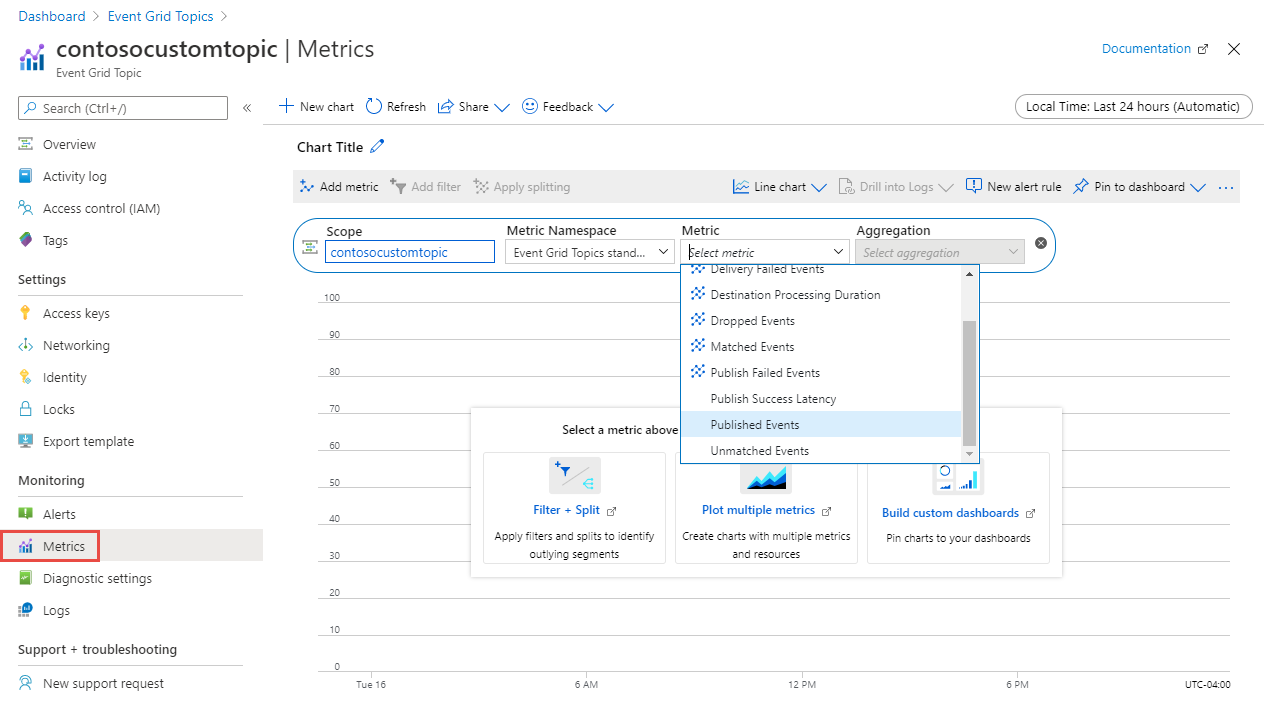
For example, see the metrics chart for the Published Events metric.
View subscription metrics
Navigate to the Event Grid Topic page by following steps from the previous section.
Select the subscription from the bottom pane as shown in the following example.
You can also search for Event Grid Subscriptions in the search bar in the Azure portal, select Topic Type, Subscription, and Location to see an event subscription.
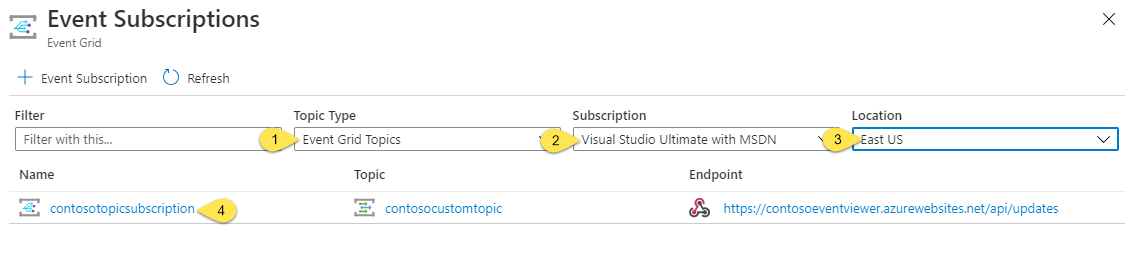
For custom topics, select Event Grid Topics as Topic Type. For system topics, select the type of the Azure resource, for example, Storage Accounts (Blob, GPv2).
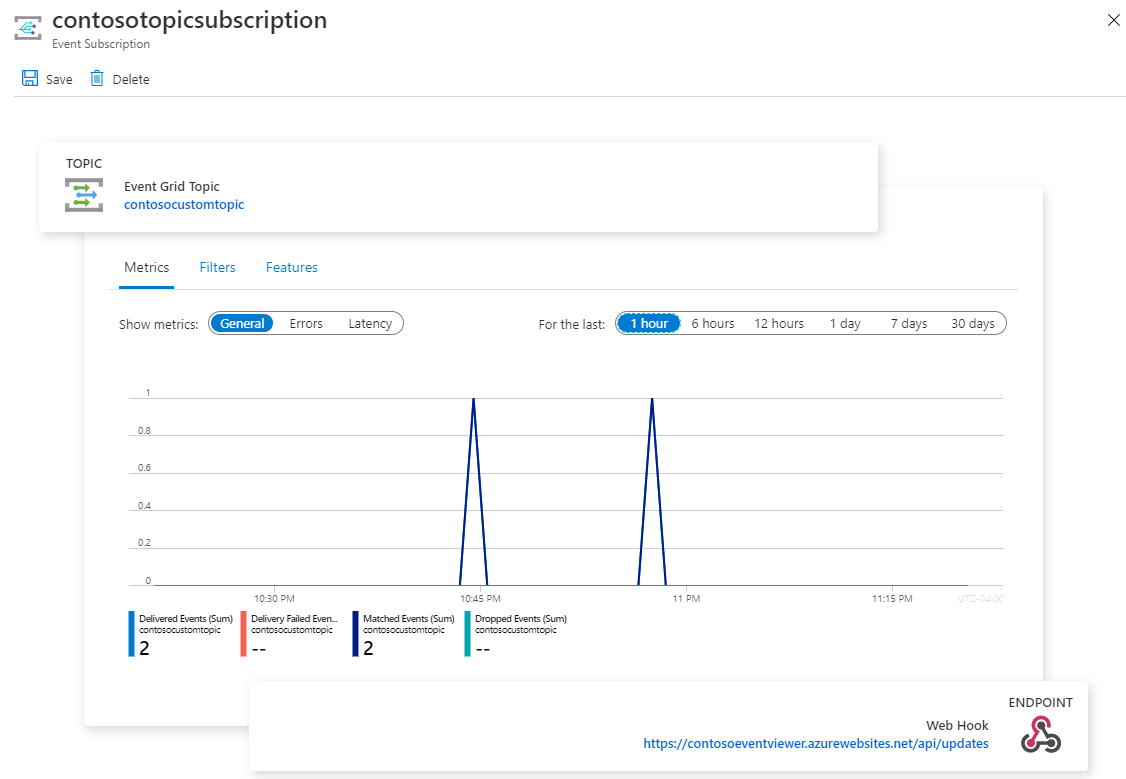
See the metrics for the subscription on the home page for the subscription in a chart. You can see General, Error, and Latency metrics for past 1 hour, 6 hours, 12 hours, 1 day, 7 days, or 30 days.
View system topic metrics
Sign in to Azure portal.
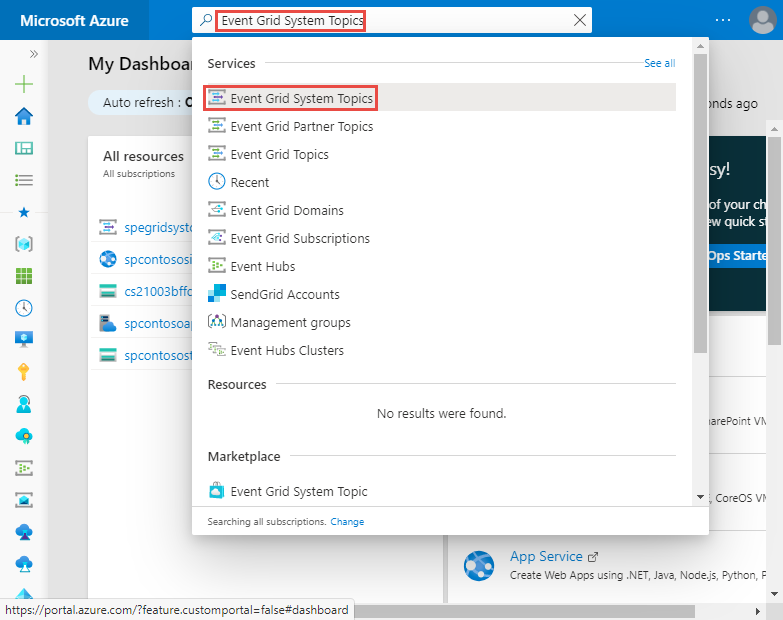
In the search bar at the topic, type Event Grid System Topics, and then select Event Grid System Topics from the drop-down list.
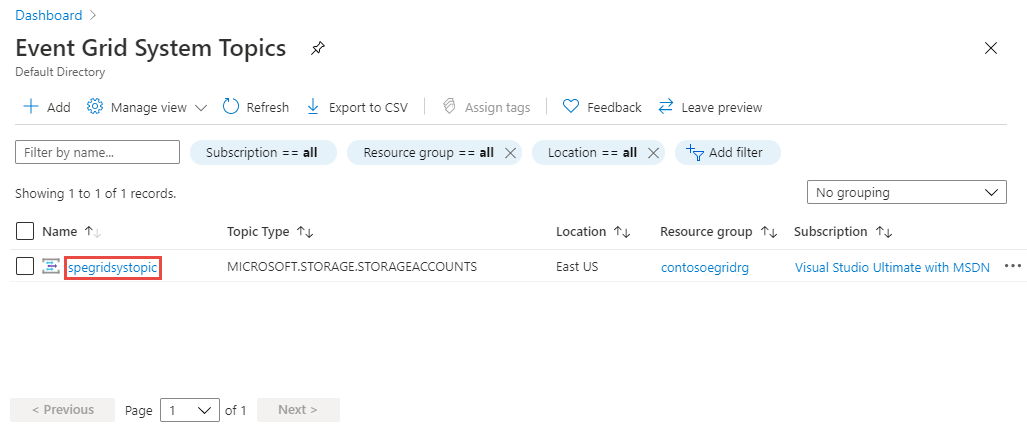
Select your system topic from the list of topics.
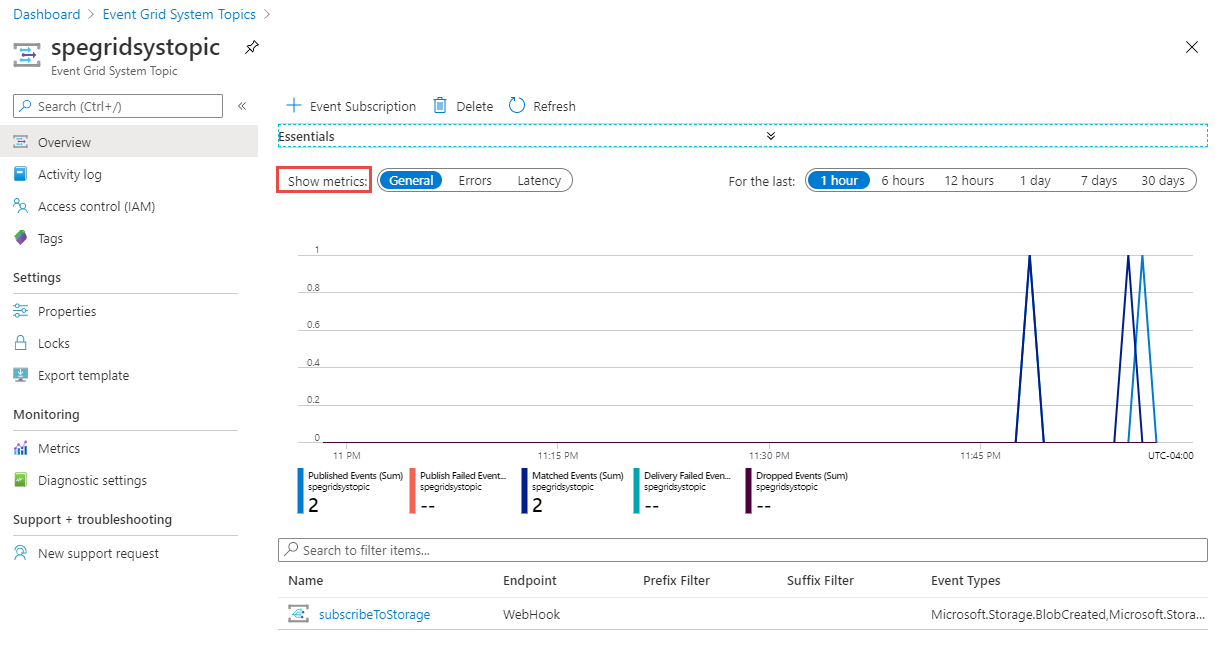
View the metrics for the system topic on the Event Grid System Topic page. In the following image, the Essentials section that shows the resource group, subscription etc. is minimized.
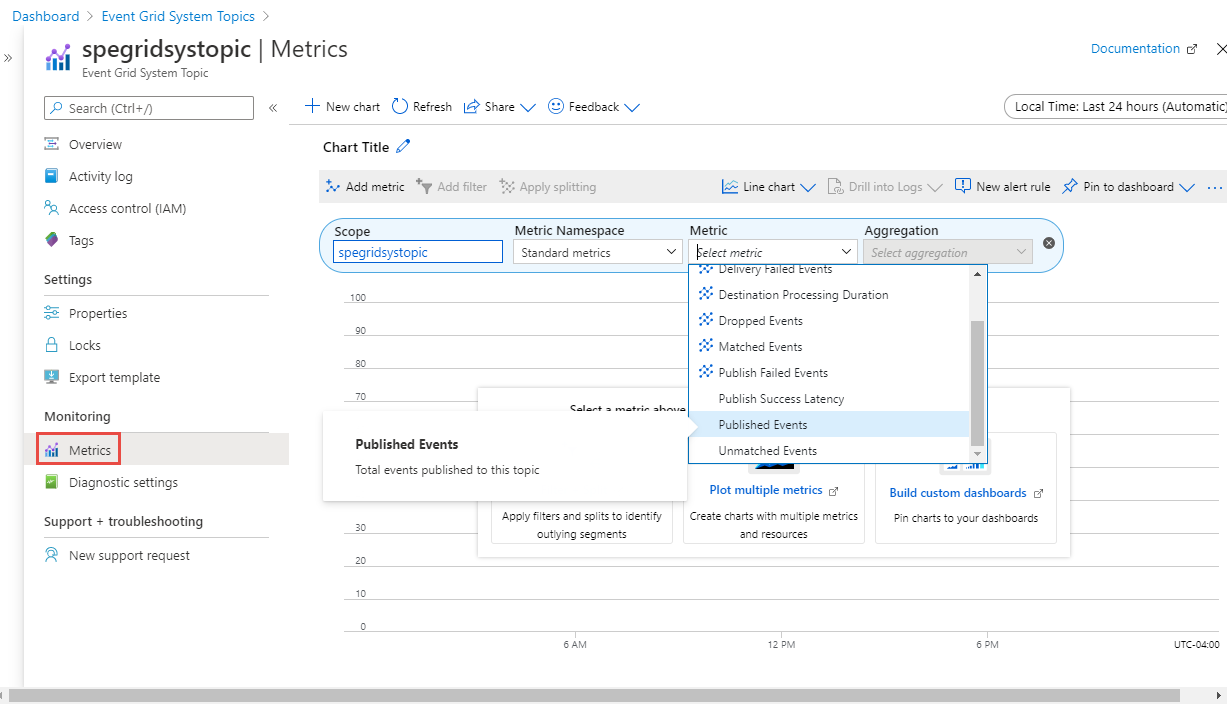
You can create charts with supported metrics by using the Metrics tab of the Event Grid Topic page.
Important
For a list of metrics supported Azure Event Grid, see Metrics.
Next steps
See the following articles:
- To learn how to create alerts on metrics and activity log operations, see Set alerts.
- For information about event delivery and retries, Event Grid message delivery and retry.