Note
Access to this page requires authorization. You can try signing in or changing directories.
Access to this page requires authorization. You can try changing directories.
Metrics in Azure Monitor are numerical values that describe some aspect of a system at a particular time. Metrics are collected every minute, and are useful for alerting because they can be sampled frequently. An alert can be fired quickly with relatively simple logic.
Firewall metrics
The following metrics are available for Azure Firewall:
Application rules hit count - The number of times an application rule has been hit.
Unit: count
Network rules hit count - The number of times a network rule has been hit.
Unit: count
Data processed - Sum of data traversing the firewall in a given time window.
Unit: bytes
Throughput - Rate of data traversing the firewall per second.
Unit: bits per second
Firewall health state - Indicates the health of the firewall based on SNAT port availability.
Unit: percent
This metric has two dimensions:
Status: Possible values are Healthy, Degraded, Unhealthy.
Reason: Indicates the reason for the corresponding status of the firewall.
If SNAT ports are used > 95%, they're considered exhausted and the health is 50% with status=Degraded and reason=SNAT port. The firewall keeps processing traffic and existing connections aren't affected. However, new connections may not be established intermittently.
If SNAT ports are used < 95%, then firewall is considered healthy and health is shown as 100%.
If no SNAT ports usage is reported, health is shown as 0%.
SNAT port utilization - The percentage of SNAT ports that have been utilized by the firewall.
Unit: percent
When you add more public IP addresses to your firewall, more SNAT ports are available, reducing the SNAT ports utilization. Additionally, when the firewall scales out for different reasons (for example, CPU or throughput) additional SNAT ports also become available. So effectively, a given percentage of SNAT ports utilization may go down without you adding any public IP addresses, just because the service scaled out. You can directly control the number of public IP addresses available to increase the ports available on your firewall. But, you can't directly control firewall scaling.
If your firewall is running into SNAT port exhaustion, you should add at least five public IP address. This increases the number of SNAT ports available. For more information, see Azure Firewall features.
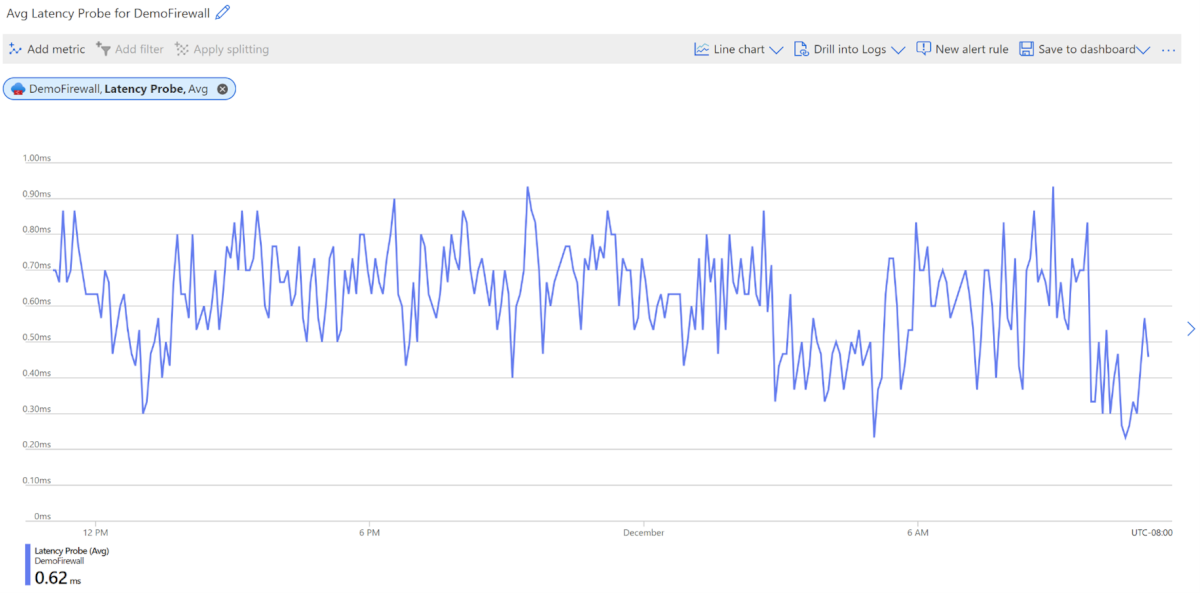
AZFW Latency Probe - Estimates Azure Firewall average latency.
Unit: ms
This metric measures the overall or average latency of Azure Firewall in milliseconds. Administrators can use this metric for the following purposes:
Diagnose if Azure Firewall is the cause of latency in the network
Monitor and alert if there are any latency or performance issues, so IT teams can proactively engage.
There may be various reasons that can cause high latency in Azure Firewall. For example, high CPU utilization, high throughput, or a possible networking issue.
This metric doesn't measure end-to-end latency of a given network path. In other words, this latency health probe doesn't measure how much latency Azure Firewall adds.
When the latency metric isn't functioning as expected, a value of 0 appears in the metrics dashboard.
As a reference, the average expected latency for a firewall is approximately 1 ms. This may vary depending on deployment size and environment.
The latency probe is based on Microsoft's Ping Mesh technology. So, intermittent spikes in the latency metric are to be expected. These spikes are normal and don't signal an issue with the Azure Firewall. They're part of the standard host networking setup that supports the system.
As a result, if you experience consistent high latency that last longer than typical spikes, consider filing a Support ticket for assistance.

Alert on Azure Firewall metrics
Metrics provide critical signals to track your resource health. So, it's important to monitor metrics for your resource and watch out for any anomalies. But what if the Azure Firewall metrics stop flowing? It could indicate a potential configuration issue or something more ominous like an outage. Missing metrics can happen because of publishing default routes that block Azure Firewall from uploading metrics, or the number of healthy instances going down to zero. In this section, you'll learn how to configure metrics to a log analytics workspace and to alert on missing metrics.
Configure metrics to a log analytics workspace
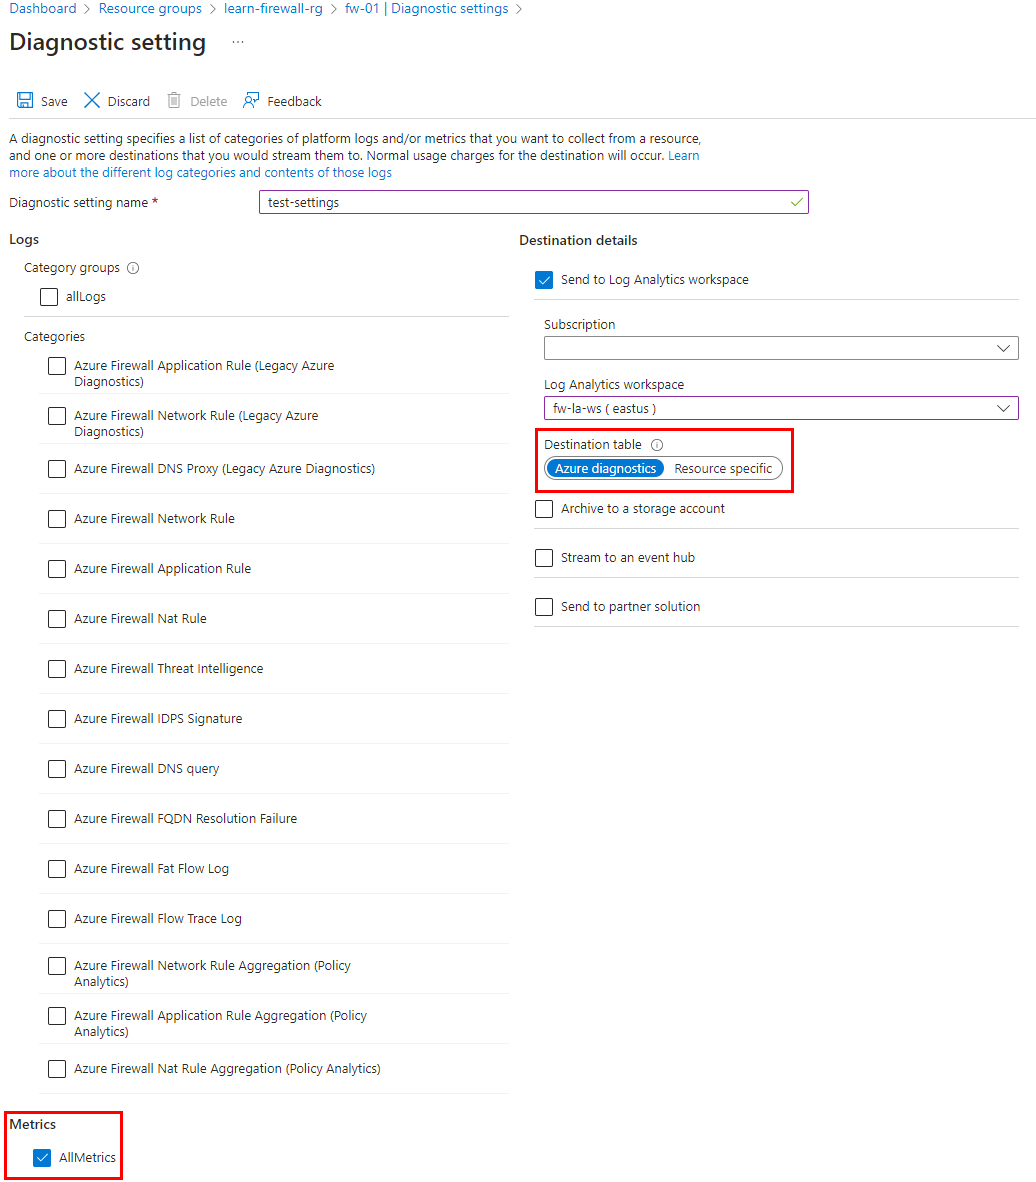
The first step is to configure metrics availability to the log analytics workspace using diagnostics settings in the firewall.
Browse to the Azure Firewall resource page to configure diagnostic settings as shown in the following screenshot. This pushes firewall metrics to the configured workspace.
Note
The diagnostics settings for metrics must be a separate configuration than logs. Firewall logs can be configured to use Azure Diagnostics or Resource Specific. However, Firewall metrics must always use Azure Diagnostics.

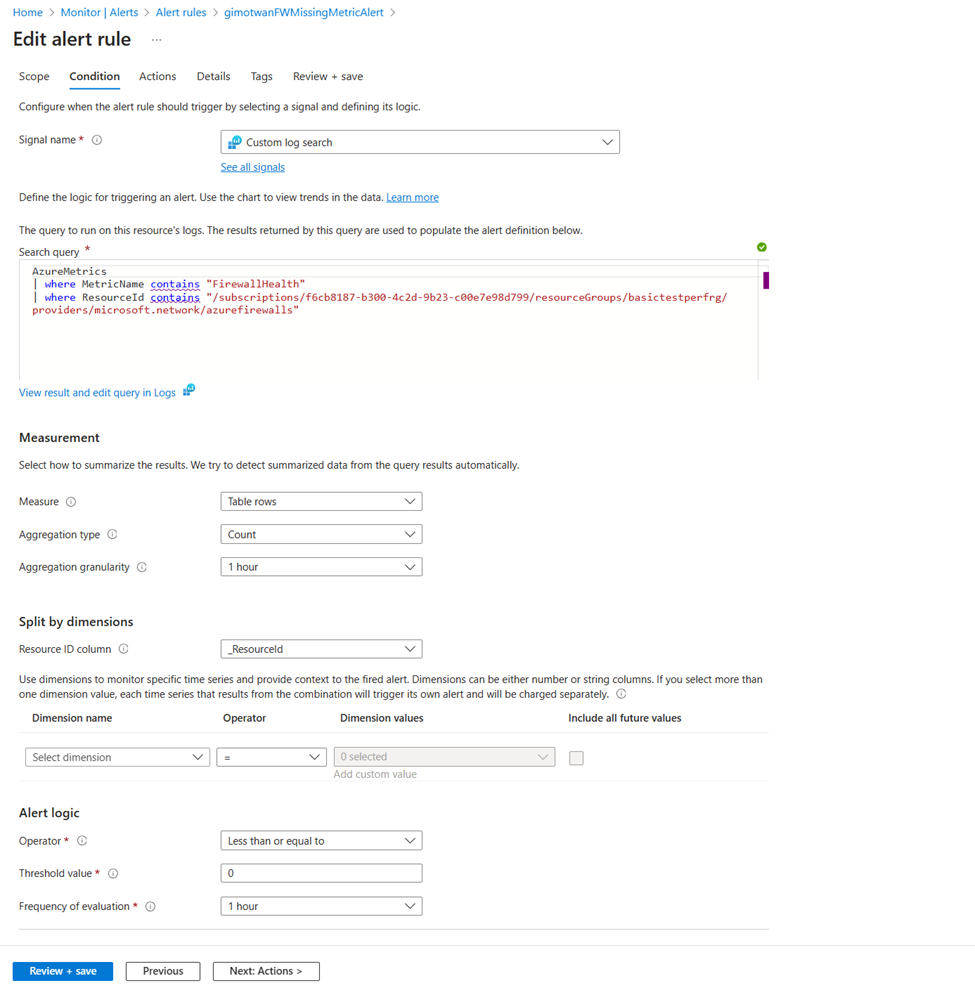
Create alert to track receiving firewall metrics without any failures
Browse to the workspace configured in the metrics diagnostics settings. Check if metrics are available using the following query:
AzureMetrics

| where MetricName contains "FirewallHealth"
| where ResourceId contains "/SUBSCRIPTIONS/XXXXXXXX-XXXX-XXXX-XXXX-XXXXXXXXXXXX/RESOURCEGROUPS/PARALLELIPGROUPRG/PROVIDERS/MICROSOFT.NETWORK/AZUREFIREWALLS/HUBVNET-FIREWALL"
| where TimeGenerated > ago(30m)
Next, create an alert for missing metrics over a time period of 60 minutes. Browse to the Alert page in the log analytics workspace to setup new alerts on missing metrics.
