Note
Access to this page requires authorization. You can try signing in or changing directories.
Access to this page requires authorization. You can try changing directories.
In this article, you learn how to track and debug Apache Spark jobs running on HDInsight clusters. Debug using the Apache Hadoop YARN UI, Spark UI, and the Spark History Server. You start a Spark job using a notebook available with the Spark cluster, Machine learning: Predictive analysis on food inspection data using MLLib. Use the following steps to track an application that you submitted using any other approach as well, for example, spark-submit.
If you don't have an Azure subscription, create a trial account before you begin.
Prerequisites
An Apache Spark cluster on HDInsight. For instructions, see Create Apache Spark clusters in Azure HDInsight.
You should have started running the notebook, Machine learning: Predictive analysis on food inspection data using MLLib. For instructions on how to run this notebook, follow the link.
Track an application in the YARN UI
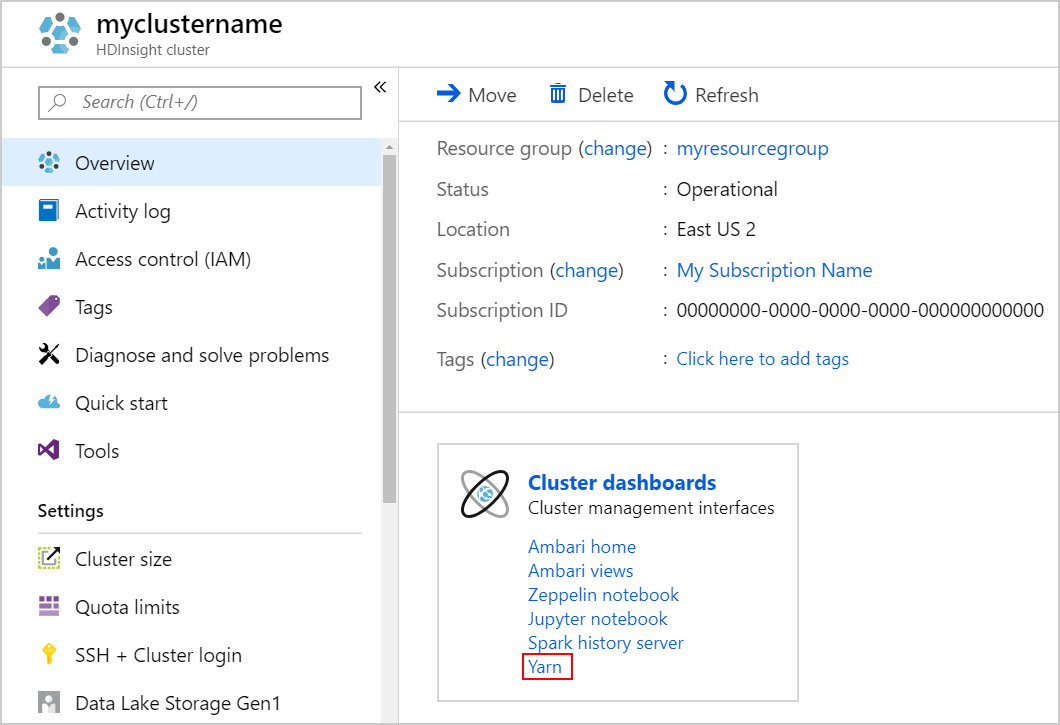
Launch the YARN UI. Select Yarn under Cluster dashboards.
Tip
Alternatively, you can also launch the YARN UI from the Ambari UI. To launch the Ambari UI, select Ambari home under Cluster dashboards. From the Ambari UI, navigate to YARN > Quick Links > the active Resource Manager > Resource Manager UI.
Because you started the Spark job using Jupyter Notebooks, the application has the name remotesparkmagics (the name for all applications started from the notebooks). Select the application ID against the application name to get more information about the job. This action launches the application view.
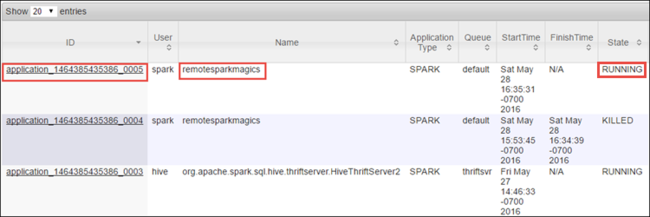
For such applications that are launched from the Jupyter Notebooks, the status is always RUNNING until you exit the notebook.
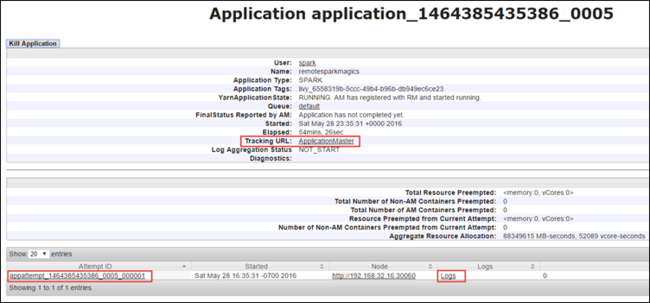
From the application view, you can drill down further to find out the containers associated with the application and the logs (stdout/stderr). You can also launch the Spark UI by clicking the linking corresponding to the Tracking URL, as shown below.
Track an application in the Spark UI
In the Spark UI, you can drill down into the Spark jobs that are spawned by the application you started earlier.
To launch the Spark UI, from the application view, select the link against the Tracking URL, as shown in the screen capture above. You can see all the Spark jobs that are launched by the application running in the Jupyter Notebook.
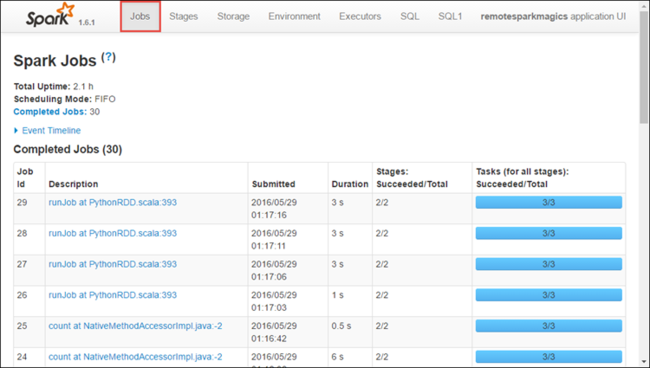
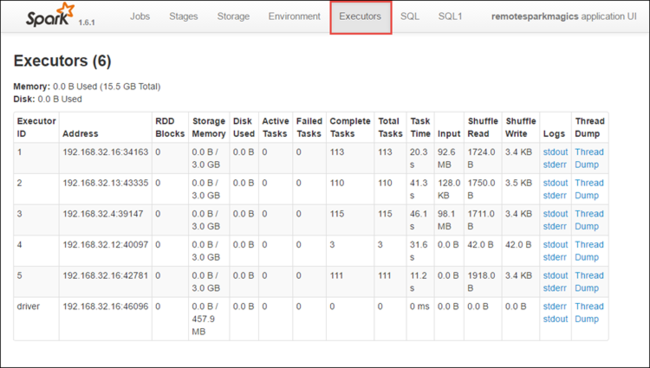
Select the Executors tab to see processing and storage information for each executor. You can also retrieve the call stack by selecting the Thread Dump link.
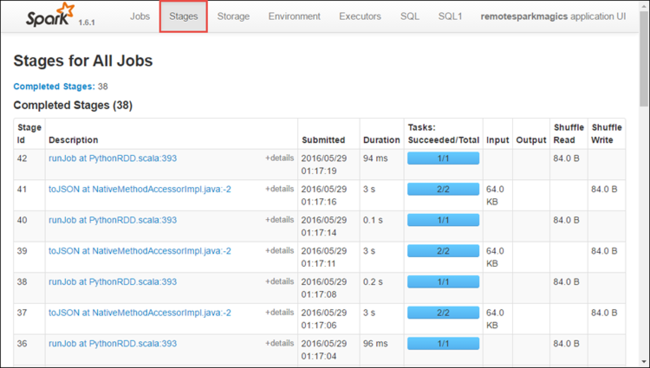
Select the Stages tab to see the stages associated with the application.
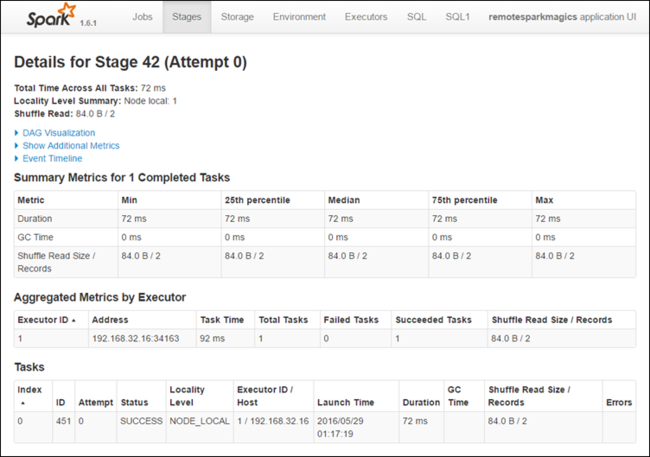
Each stage can have multiple tasks for which you can view execution statistics, like shown below.
From the stage details page, you can launch DAG Visualization. Expand the DAG Visualization link at the top of the page, as shown below.
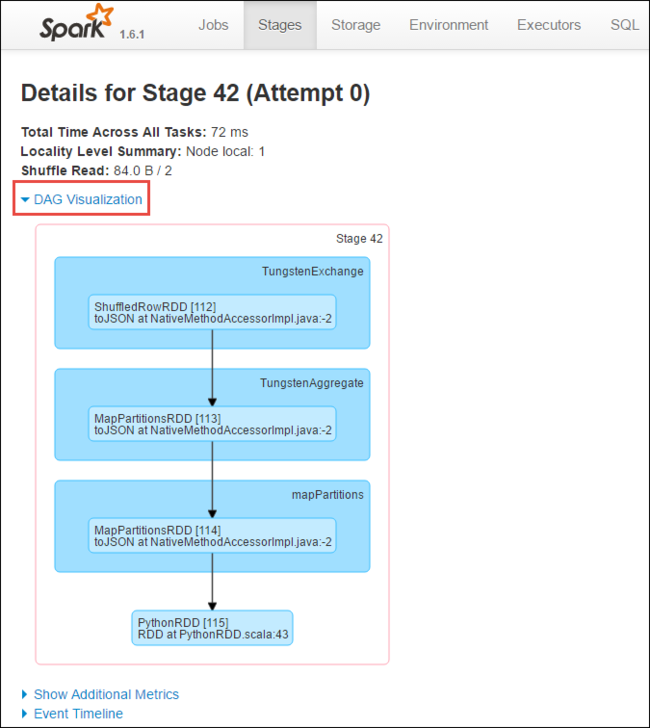
DAG or Direct Aclyic Graph represents the different stages in the application. Each blue box in the graph represents a Spark operation invoked from the application.
From the stage details page, you can also launch the application timeline view. Expand the Event Timeline link at the top of the page, as shown below.
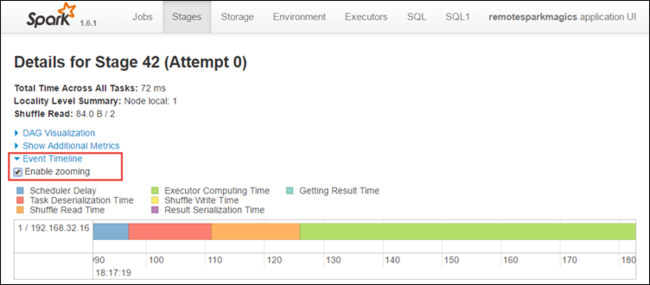
This image displays the Spark events in the form of a timeline. The timeline view is available at three levels, across jobs, within a job, and within a stage. The image above captures the timeline view for a given stage.
Tip
If you select the Enable zooming check box, you can scroll left and right across the timeline view.
Other tabs in the Spark UI provide useful information about the Spark instance as well.
- Storage tab - If your application creates an RDD, you can find information in the Storage tab.
- Environment tab - This tab provides useful information about your Spark instance such as the:
- Scala version
- Event log directory associated with the cluster
- Number of executor cores for the application
Find information about completed jobs using the Spark History Server
Once a job is completed, the information about the job is persisted in the Spark History Server.
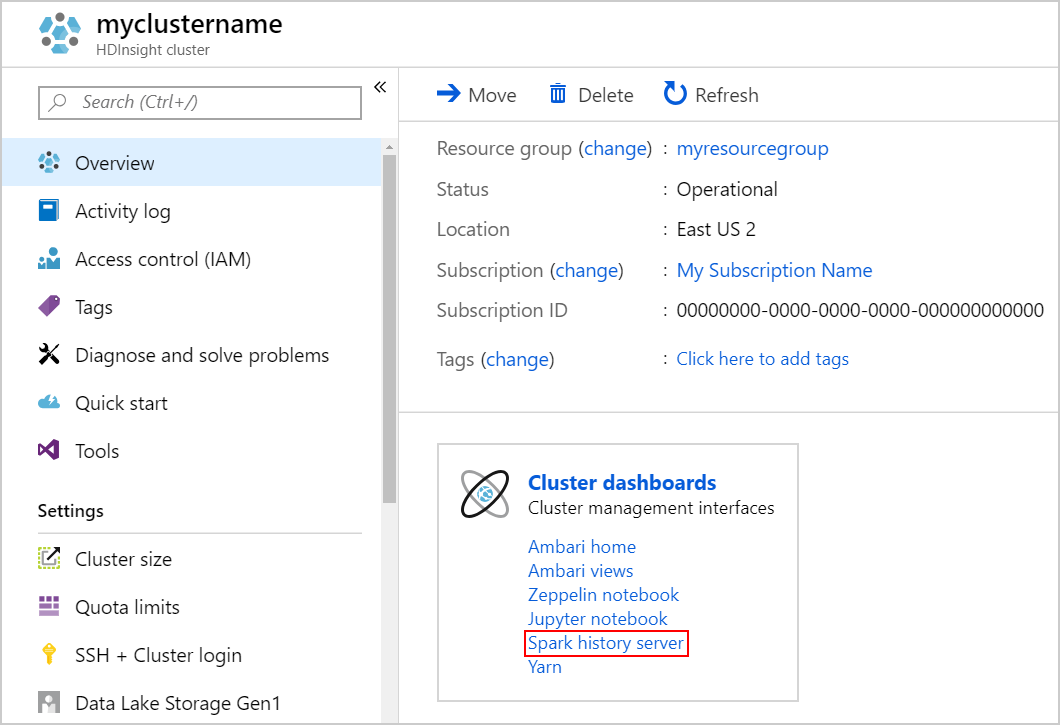
To launch the Spark History Server, from the Overview page, select Spark history server under Cluster dashboards.
Tip
Alternatively, you can also launch the Spark History Server UI from the Ambari UI. To launch the Ambari UI, from the Overview blade, select Ambari home under Cluster dashboards. From the Ambari UI, navigate to Spark2 > Quick Links > Spark2 History Server UI.
You see all the completed applications listed. Select an application ID to drill down into an application for more info.
