Note
Access to this page requires authorization. You can try signing in or changing directories.
Access to this page requires authorization. You can try changing directories.
This article contains all the monitoring reference information for this service.
See Monitor Azure NAT Gateway for details on the data you can collect for Azure NAT Gateway and how to use it.
Metrics
This section lists all the automatically collected platform metrics for this service. These metrics are also part of the global list of all platform metrics supported in Azure Monitor.
For information on metric retention, see Azure Monitor Metrics overview.
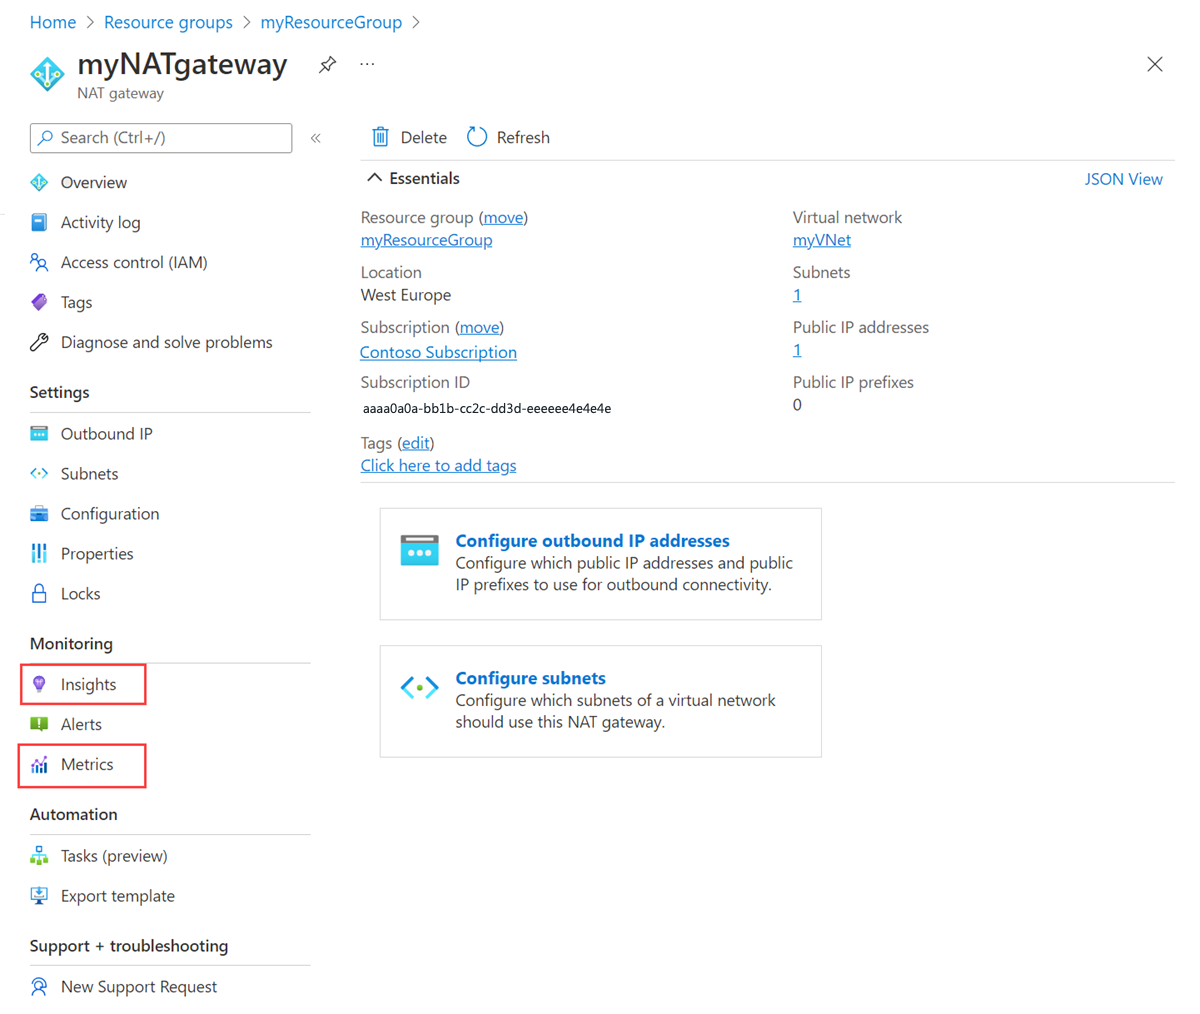
NAT gateway metrics can be found in the following locations in the Azure portal.
Metrics page under Monitoring from a NAT gateway's resource page.
Insights page under Monitoring from a NAT gateway's resource page.
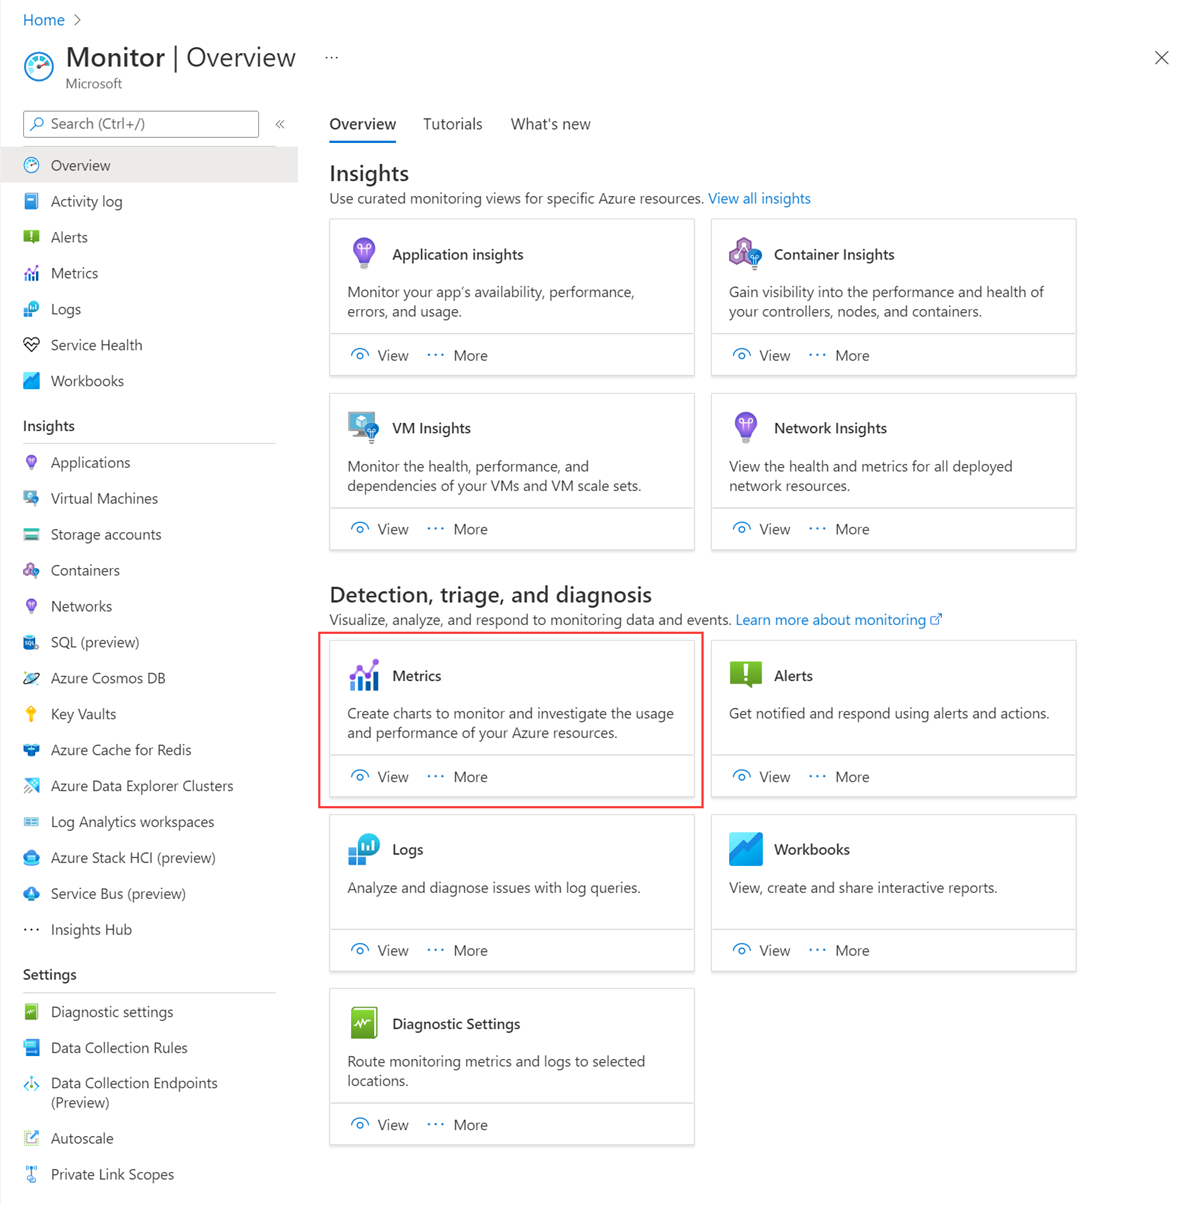
Azure Monitor page under Metrics.
Supported metrics for Microsoft.Network/natgateways
The following table lists the metrics available for the Microsoft.Network/natgateways resource type.
Table headings
- Metric - The metric display name as it appears in the Azure portal.
- Name in Rest API - Metric name as referred to in the REST API.
- Unit - Unit of measure.
- Aggregation - The default aggregation type. Valid values: Average, Minimum, Maximum, Total, Count.
- Dimensions - Dimensions available for the metric.
- Time Grains - Intervals at which the metric is sampled. For example,
PT1Mindicates that the metric is sampled every minute,PT30Mevery 30 minutes,PT1Hevery hour, and so on. - DS Export- Whether the metric is exportable to Azure Monitor Logs via Diagnostic Settings. For information on exporting metrics, see Create diagnostic settings in Azure Monitor.
| Metric | Name in REST API | Unit | Aggregation | Dimensions | Time Grains | DS Export |
|---|---|---|---|---|---|---|
| Bytes Total number of Bytes transmitted within time period |
ByteCount |
Bytes | Total (Sum) | Protocol, Direction |
PT1M | No |
| Datapath Availability NAT Gateway Datapath Availability |
DatapathAvailability |
Count | Average | <none> | PT1M | No |
| Packets Total number of Packets transmitted within time period |
PacketCount |
Count | Total (Sum) | Protocol, Direction |
PT1M | No |
| Dropped Packets Count of dropped packets |
PacketDropCount |
Count | Total (Sum) | <none> | PT1M | No |
| SNAT Connection Count Total concurrent active connections |
SNATConnectionCount |
Count | Total (Sum) | Protocol, ConnectionState |
PT1M | No |
| Total SNAT Connection Count Total number of active SNAT connections |
TotalConnectionCount |
Count | Total (Sum) | Protocol |
PT1M | No |
Note
Count aggregation is not recommended for any of the NAT gateway metrics. Count aggregation adds up the number of metric values and not the metric values themselves. Use Total aggregation instead to get the best representation of data values for connection count, bytes, and packets metrics.
Use Average for best represented health data for the datapath availability metric.
For information about aggregation types, see aggregation types.
For more information, see How to use NAT gateway metrics.
Metric dimensions
For information about what metric dimensions are, see Multi-dimensional metrics.
This service has the following dimensions associated with its metrics.
- ConnectionState: Attempted, Failed
- Direction: In, Out
- Protocol: 6 TCP, 17 UDP
Activity log
The linked table lists the operations that may be recorded in the activity log for this service. This is a subset of all the possible resource provider operations in the activity log.
For more information on the schema of activity log entries, see Activity Log schema.
Related content
- See Monitor Azure NAT Gateway for a description of monitoring Azure NAT Gateway.
- See Monitor Azure resources with Azure Monitor for details on monitoring Azure resources.