Note
Access to this page requires authorization. You can try signing in or changing directories.
Access to this page requires authorization. You can try changing directories.
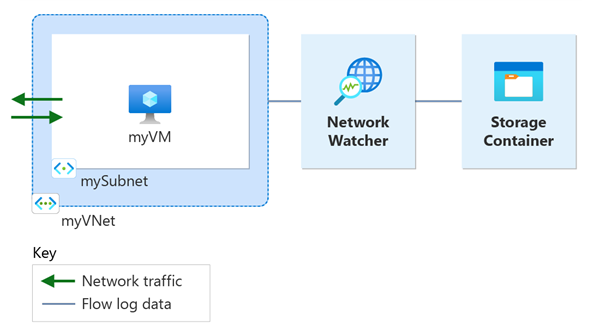
Virtual network flow logging is a feature of Azure Network Watcher that allows you to log information about IP traffic flowing through an Azure virtual network. For more information about virtual network flow logging, see Virtual network flow logs.
This tutorial helps you use VNet flow logs to log a virtual machine's network traffic that flows through the virtual network.
In this tutorial, you learn how to:
- Create a virtual network
- Create a virtual machine
- Register Microsoft.insights provider
- Enable flow logging for a virtual network using Network Watcher flow logs
- Download logged data
- View logged data
Prerequisites
- An Azure account with an active subscription. If you don't have one, create a trial subscription before you begin.
Create a virtual network
In this section, you create myVNet virtual network with one subnet for the virtual machine.
Sign in to the Azure portal.
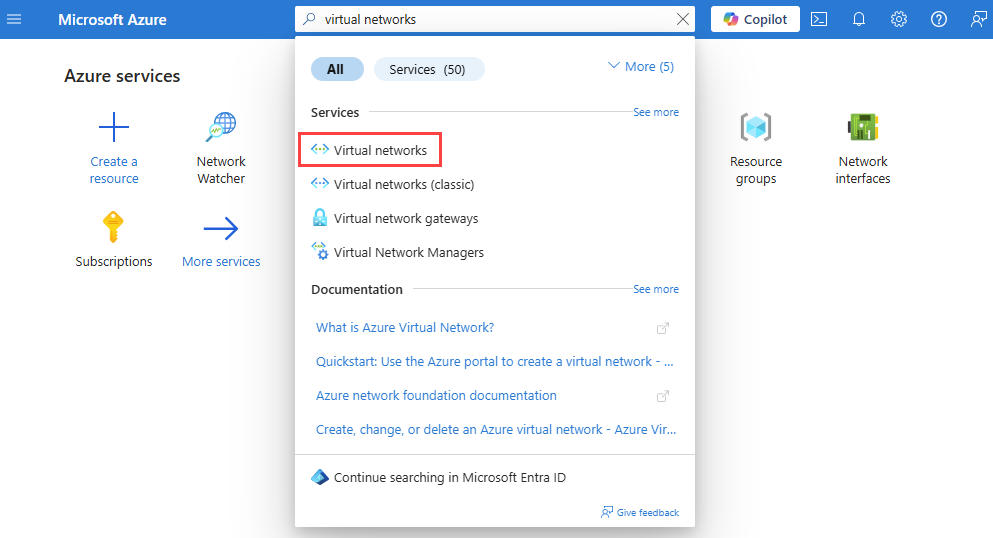
In the search box at the top of the portal, enter virtual networks. Select Virtual networks from the search results.
Select + Create. In Create virtual network, enter or select the following values in the Basics tab:
Setting Value Project details Subscription Select your Azure subscription. Resource Group Select Create new.
Enter myResourceGroup in Name.
Select OK.Instance details Name Enter myVNet. Region Select (Asia Pacific) China East. Select Review + create.
Review the settings, and then select Create.

Deploy Azure Bastion
Azure Bastion uses your browser to connect to VMs in your virtual network over secure shell (SSH) or remote desktop protocol (RDP) by using their private IP addresses. The VMs don't need public IP addresses, client software, or special configuration. For more information about Azure Bastion, see Azure Bastion.
Note
Hourly pricing starts from the moment that Bastion is deployed, regardless of outbound data usage. For more information, see Pricing and SKUs. If you're deploying Bastion as part of a tutorial or test, we recommend that you delete this resource after you finish using it.
In the search box at the top of the portal, enter Bastion. Select Bastions from the search results.
Select + Create.
In the Basics tab of Create a Bastion, enter or select the following information:
Setting Value Project details Subscription Select your Azure subscription. Resource group Select myResourceGroup. Instance details Name Enter bastion. Region Select ** China East**. Tier Select Developer. Configure virtual networks Virtual network Select myVNet. Select Review + create.
Select Create.
Create a virtual machine
In this section, you create myVM virtual machine.
In the search box at the top of the portal, enter virtual machines. Select Virtual machines from the search results.
Select + Create and then select Virtual machine.
In Create a virtual machine, enter or select the following values in the Basics tab:
Setting Value Project Details Subscription Select your Azure subscription. Resource Group Select myResourceGroup. Instance details Virtual machine name Enter myVM. Region Select (Asia Pacific) China East. Availability Options Select No infrastructure redundancy required. Security type Select Standard. Image Select the image that you prefer. This tutorial uses Windows Server 2022 Datacenter: Azure Edition - x64 Gen2. Size Choose a VM size or leave the default setting. Administrator account Username Enter a username. Password Enter a password. Confirm password Reenter password. Select the Networking tab, or select Next: Disks, then Next: Networking.
In the Networking tab, select the following values:
Setting Value Network interface Virtual network Select myVNet. Subnet Select mySubnet. Public IP Select None. NIC network security group Select Basic. Public inbound ports Select None. Select Review + create.
Review the settings, and then select Create.
Once the deployment is complete, select Go to resource to go to the Overview page of myVM.
Select Connect then select Connect via Bastion.
In the Bastion connection page, enter or select the following information:
Setting Value Authentication Type Select Password. Username Enter the username you created. Password Enter the password you created. Select Connect.
Register Insights provider
Flow logging requires the Microsoft.Insights provider. To check its status, follow these steps:
In the search box at the top of the portal, enter subscriptions. Select Subscriptions from the search results.
Select the Azure subscription that you want to enable the provider for in Subscriptions.
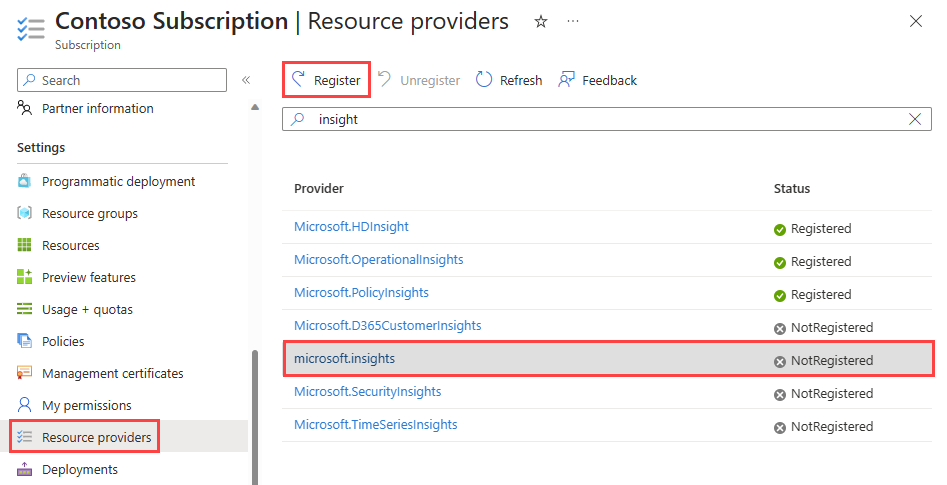
Under Settings, select Resource providers.
Enter insight in the filter box.
Confirm the status of the provider displayed is Registered. If the status is NotRegistered, select the Microsoft.Insights provider then select Register.

Create a storage account
In this section, you create a storage account to use it to store the flow logs.
In the search box at the top of the portal, enter storage accounts. Select Storage accounts from the search results.
Select + Create. In Create a storage account, enter or select the following values in the Basics tab:
Setting Value Project details Subscription Select your Azure subscription. Resource Group Select myResourceGroup. Instance details Storage account name Enter a unique name. This tutorial uses nwteststorageaccount. Region Select (Asia Pacific) China East. The storage account must be in the same region as the virtual machine and its network security group. Primary service Select Azure Blob Storage or Azure Data Lake Storage Gen 2. Performance Select Standard. Flow logs only support Standard-tier storage accounts. Redundancy Select the redundancy you prefer (all Azure Storage redundancy configurations are supported). This tutorial uses Locally-redundant storage (LRS). Select the Review tab or select the Review button at the bottom.
Review the settings, and then select Create.
Create a flow log
In this section, you create a virtual network flow log that's saved into the storage account created previously in the tutorial.
In the search box at the top of the portal, enter network watcher. Select Network Watcher from the search results.
Under Logs, select Flow logs.
In Network Watcher | Flow logs, select + Create or Create flow log blue button.

Enter or select the following values in Create a flow log:
Setting Value Project details Subscription Select the Azure subscription of your network security group that you want to log. Flow log type Select Virtual network. Virtual Network Select + Select target resource.
In Select virtual network, select myVNet. Then, select Confirm selection.Flow Log Name Leave the default of myVNet-myresourcegroup-flowlog. Instance details Subscription Select the Azure subscription of your storage account. Storage accounts Select the storage account you created in the previous steps. Retention (days) Enter 10 to retain the flow logs data in the storage account for 10 days. To keep the flow logs data in the storage account forever (until you delete it), enter 0. For information about storage pricing, see Azure Storage pricing. 
Note
The Azure portal creates virtual network flow logs in the NetworkWatcherRG resource group.
Select Review + create.
Review the settings, and then select Create.
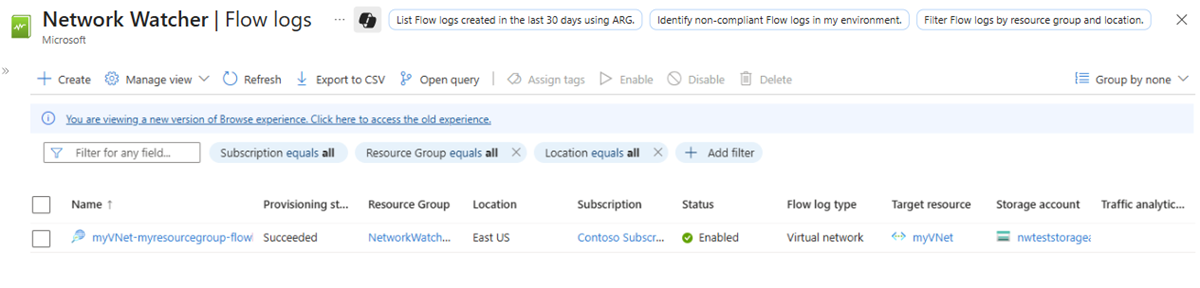
Once the deployment is complete, select Go to resource to confirm the flow log created and listed in the Flow logs page.
Go back to your Bastion session with myVM virtual machine.
Open Microsoft Edge and go to
www.bing.com.


Download the flow log
In this section, you go to the storage account you previously selected and download the flow log created in the previous section.
In the search box at the top of the portal, enter storage accounts. Select Storage accounts from the search results.
Select nwteststorageaccount or the storage account you previously created and selected to store the logs.
Under Data storage, select Containers.
Select the insights-logs-flowlogflowevent container.
In the container, navigate the folder hierarchy until you get to the
PT1H.jsonfile that you want to download. Virtual network flow log files follow the following path::https://{storageAccountName}.blob.core.chinacloudapi.cn/insights-logs-flowlogflowevent/flowLogResourceID=/{subscriptionID}_NETWORKWATCHERRG/NETWORKWATCHER_{Region}_{ResourceName}-{ResourceGroupName}-FLOWLOGS/y={year}/m={month}/d={day}/h={hour}/m=00/macAddress={macAddress}/PT1H.jsonSelect the ellipsis ... to the right of the PT1H.json file, then select Download.


Note
You can use Azure Storage Explorer to access and download flow logs from your storage account. For more information, see Get started with Storage Explorer.
View the flow log
Open the downloaded PT1H.json file using a text editor of your choice. The following example is a section taken from the downloaded PT1H.json file, which shows a flow processed by the rule DefaultRule_AllowInternetOutBound.
{
    "time": "2025-08-06T20:39:33.3186341Z",
    "flowLogGUID": "00000000-0000-0000-0000-000000000000",
    "macAddress": "6045BDD6DD48",
    "category": "FlowLogFlowEvent",
    "resourceId": "/SUBSCRIPTIONS/aaaa0a0a-bb1b-cc2c-dd3d-eeeeee4e4e4e//RESOURCEGROUPS/NETWORKWATCHERRG/PROVIDERS/MICROSOFT.NETWORK/NETWORKWATCHERS/NETWORKWATCHER_China East/FLOWLOGS/MYVNET-MYRESOURCEGROUP-FLOWLOG",
	"flowLogVersion": 4,
    "operationName": "FlowLogFlowEvent",
    "flowRecords": {
        "flows": [
            {
				"aclID": "00000000-0000-0000-0000-000000000000",
				"flowGroups": [
					{
                        "rule": "DefaultRule_AllowInternetOutBound",
                        "flowTuples": [
                            "1754512773,10.0.0.4,13.107.21.200,49982,443,6,O,C,NX,7,1158,12,8143"
                        ]
                    }
                ]
            }
        ]
    }
}
The comma-separated information for flowTuples is as follows:
| Example data | What data represents | Explanation |
|---|---|---|
| 1754512773 | Time stamp | The time stamp of when the flow occurred in UNIX EPOCH format. In the previous example, the date converts to August 06, 2025 08:39:33 PM UTC/GMT. |
| 10.0.0.4 | Source IP address | The source IP address that the flow originated from. 10.0.0.4 is the private IP address of the VM you previously created. |
| 13.107.21.200 | Destination IP address | The destination IP address that the flow was destined to. 13.107.21.200 is the IP address of www.bing.com. Since the traffic is destined outside Azure, the security rule DefaultRule_AllowInternetOutBound processed the flow. |
| 49982 | Source port | The source port that the flow originated from. |
| 443 | Destination port | The destination port that the flow was destined to. |
| 6 | Protocol | The layer 4 protocol of the flow in IANA assigned values: 6: TCP. |
| O | Direction | The direction of the flow. O: Outbound. |
| C | Flow state | The state of the flow. C: Continuing for an ongoing flow. |
| NX | Flow encryption | The connection is unencrypted. |
| 7 | Packets sent | The total number of TCP packets sent to destination since the last update. |
| 1158 | Bytes sent | The total number of TCP packet bytes sent from source to destination since the last update. Packet bytes include the packet header and payload. |
| 12 | Packets received | The total number of TCP packets received from destination since the last update. |
| 8143 | Bytes received | The total number of TCP packet bytes received from destination since the last update. Packet bytes include packet header and payload. |
Clean up resources
When no longer needed, delete myResourceGroup resource group and all of the resources it contains:
In the search box at the top of the portal, enter myResourceGroup. Select myResourceGroup from the search results.
Select Delete resource group.
In Delete a resource group, enter myResourceGroup, and then select Delete.
Select Delete to confirm the deletion of the resource group and all its resources.
Note
The NetworkWatcher_chinaeast/myVNet-myresourcegroup-flowlog resource is in the NetworkWatcherRG resource group, but it'll be deleted after deleting the myVNet virtual network (by deleting the myResourceGroup resource group).