Note
Access to this page requires authorization. You can try signing in or changing directories.
Access to this page requires authorization. You can try changing directories.
Virtual Network flow logs allow you to view information about ingress and egress IP traffic on Virtual Networks. These flow logs show outbound and inbound flows on a per rule basis, the network interface (NIC) the flow applies to, 5-tuple information about the flow (Source/Destination IP, Source/Destination Port, Protocol), and if the traffic was allowed or denied.
It can be difficult to gain insights into flow logging data by manually searching the log files. In this article, you learn how to visualize your most recent flow logs to learn more about traffic on your network.
Important
Network security group (NSG) flow logs will be retired on September 30, 2027. After June 30, 2025, you'll no longer be able to create new NSG flow logs. We recommend migrating to virtual network flow logs, which address the limitations of NSG flow logs. After the retirement date, traffic analytics enabled for NSG flow logs will no longer be supported, and existing NSG flow log resources in your subscriptions will be deleted. However, existing NSG flow log records won't be deleted from Azure Storage and will continue to follow their configured retention policies. For more information, see the official announcement.
Network security group flow logs allow you to view information about ingress and egress IP traffic on network security groups. These flow logs show outbound and inbound flows on a per rule basis, the NIC the flow applies to, 5-tuple information about the flow (Source/Destination IP, Source/Destination Port, Protocol), and if the traffic was allowed or denied.
It can be difficult to gain insights into flow logging data by manually searching the log files. In this article, you learn how to visualize your most recent flow logs to learn more about traffic on your network.
Warning
The following steps work with flow logs version 1. For details, see Introduction to flow logging for network security groups. The following instructions will not work with version 2 of the log files, without modification.
Prerequisites
- An Azure account with an active subscription. Create a trial subscription.
- Flow logging enabled on one or more virtual networks in your account. For more information, see Manage virtual network flow logs.
- Flow logging enabled on one or more network security groups in your account. For more information, see Manage network security group flow logs.
- Power BI Desktop installed on your machine with enough free space to download and load the log data that exists in your storage account. For more information, see Get started with Power BI Desktop.
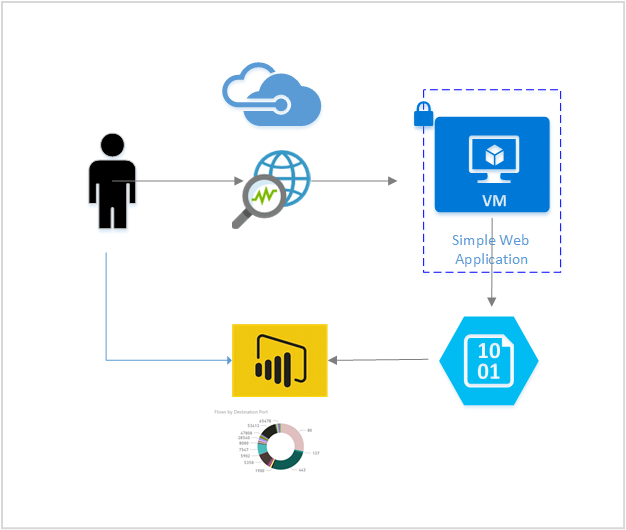
Scenario
In the following scenario, you connect Power BI desktop to your storage account configured as the sink for your flow logging data. After you connect to the storage account, Power BI downloads and parses the logs to provide a visual representation of logged traffic.
Using the visuals supplied in the template you can examine:
Top talkers
Time series flow data by direction and rule decision
Flows by network interface MAC address
Flows by destination port
- Flows by virtual network and rule
- Flows by network security group and rule
The template is editable so you can modify it to add new data, visuals, or edit queries to suit your needs.
Set up your Power BI dashboard
- Download and open the following Power BI template in your Power BI Desktop Network Watcher Power BI flow logs template
- Download and open the following Power BI template in your Power BI Desktop Network Watcher Power BI flow logs template
Enter the required query parameters:
StorageAccountName: the name of the storage account containing the flow logs that you want to load and visualize.
NumberOfLogFiles: the number of log files that you want to download and visualize in Power BI. For example, if you enter 50, then you can view the latest 50 log files. If you have two virtual networks enabled and configured to send flow logs to this account, then you can view the past 25 hours of logs.
Enter the required query parameters:
StorageAccountName: the name of the storage account containing the flow logs that you want to load and visualize.
NumberOfLogFiles: the number of log files that you want to download and visualize in Power BI. For example, if you enter 50, then you can view the latest 50 log files. If you have two network security groups enabled and configured to send flow logs to this account, then you can view the past 25 hours of logs.
Enter the access key for your storage account. You can find valid access keys by going to your storage account in the Azure portal and selecting Access keys under Security + networking.
Select Connect then apply changes.
Use the precreated visuals to view your logs.
Understand the visuals
The template includes a set of visuals that help you analyze your flow log data. The following sections describe each visual in detail, with sample images showing what the dashboard looks like when populated with data.
Dashboard


Top talkers
The top talkers visual shows the IPs that have initiated the most connections over the period specified. The size of the boxes corresponds to the relative number of connections.


Flows over time and by direction/decision
The following time series graphs show the number of flows over the period. The first graph is segmented by the flow direction, and the second one is segmented by the decision made (allow or deny). With this visual, you can examine your traffic trends over time, and spot any abnormal spikes or decline in traffic or traffic segmentation.


Flows by network interface
The following graphs show the flows per network interface. The first graph is segmented by flow direction and the second one is segmented by decision made. With this information, you can gain insights into which of your virtual machines (VMs) communicated the most relative to others, and if traffic to a specific VM is being allowed or denied.

Flows by destination port
The following wheel chart shows a breakdown of flows by destination port. With this information, you can view the most commonly used destination ports used within the specified period.


Flows by virtual network and rule
The following bar chart shows the flow by virtual network and rule. With this information, you can see the virtual networks responsible for the most traffic, and the breakdown of traffic on a virtual network by rule.

Flows by network security group and rule
The following bar chart shows the flow by network security group and rule. With this information, you can see the network security groups responsible for the most traffic, and the breakdown of traffic on a network security group by rule.

Considerations
Logs by default are stored in
https://{storageAccountName}.blob.core.chinacloudapi.cn/insights-logs-insights-logs-flowlogflowevent/- Modify the queries if your data exists in a different directory.
Logs by default are stored in
https://{storageAccountName}.blob.core.chinacloudapi.cn/insights-logs-networksecuritygroupflowevent/- Modify the queries if your data exists in a different directory.
The provided template isn't recommended for use with more than 1 GB of logs.
If you have a large amount of log data, we recommend that you investigate a solution using another data store like Data Lake or SQL server.