Note
Access to this page requires authorization. You can try signing in or changing directories.
Access to this page requires authorization. You can try changing directories.
Debug Sessions is a visual editor that works with an existing skillset in the Azure portal, exposing the structure and content of a single enriched document as it's produced by an indexer and skillset for the duration of the session. Because you're working with a live document, the session is interactive - you can identify errors, modify and invoke skill execution, and validate the results in real time. If your changes resolve the problem, you can commit them to a published skillset to apply the fixes globally.
This article explains supported scenarios and how the editor is organized. Tabs and sections of the editor unpack different layers of the skillset so that you can examine skillset structure, flow, and the content it generates at run time.
Supported scenarios
Use Debug Sessions to investigate and resolve problems with:
Built-in skills used for AI enrichment, such as OCR, image analysis, entity recognition, and keyword extraction.
Built-in skills used for integrated vectorization, with data chunking through Text Split, and vectorization through an embedding skill.
Custom skills used to integrate external processing that you provide.
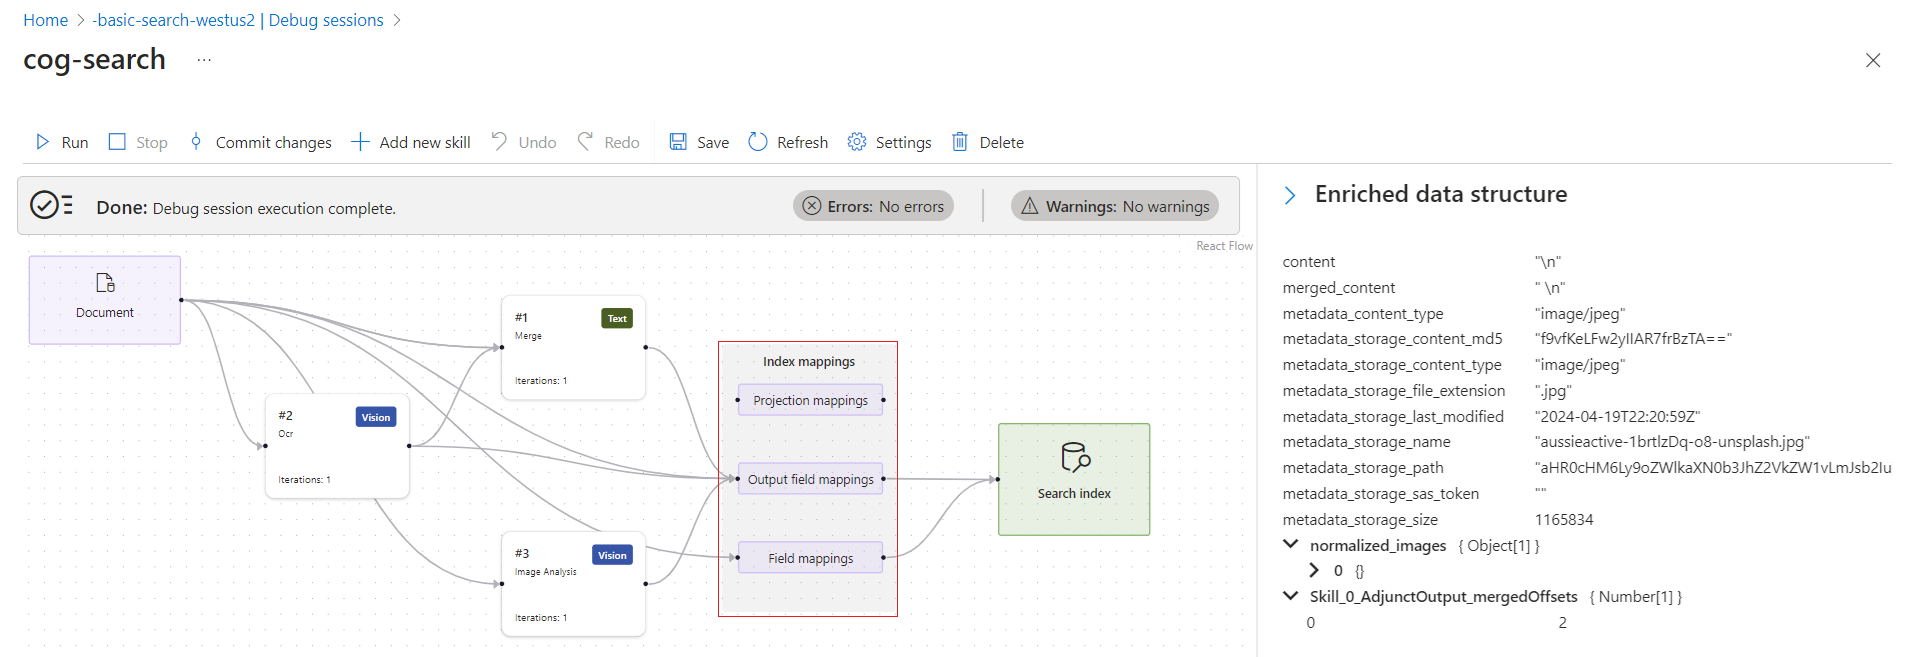
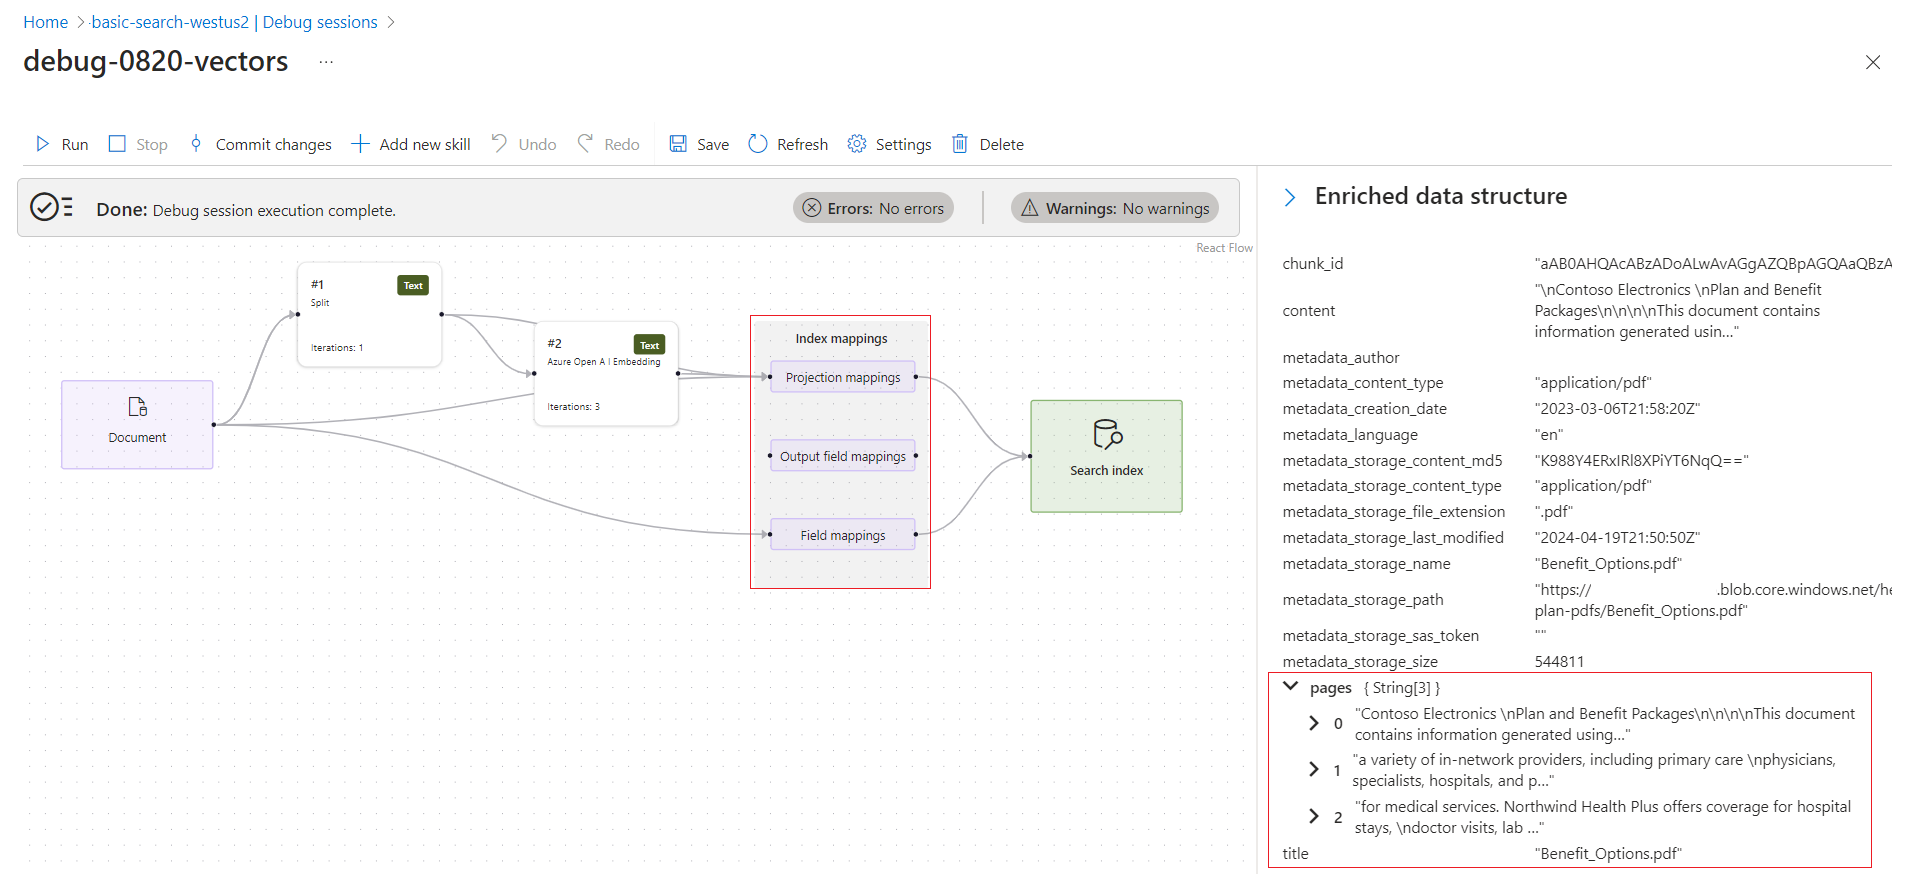
Compare the following debug session images for the first two scenarios. For both scenarios, the surface area shows the progression of skills that generate or transform content en route from the source document to the search index. The flow includes index mapping options, and you can trace the arrows to follow the processing trail. The details pane to the right is context-sensitive. It shows a representation of the enriched document that's created by the pipeline, or the details of a skill or mapping.
The first image shows a pattern for applied AI enrichment (no vectors). Skills can run sequentially or in parallel if there are no dependencies. Index mappings show how enriched or generated content travels from in-memory data structures to fields in an index. Enriched document shows the data structure that the skillset creates.
The second image shows a typical pattern for integrated vectorization. Skills for integrated vectorization usually include a Text Split skill and an embedding skill. A Text Split skill divides a document into chunks. An embedding skill calls an embedding API to vectorize those chunks. This particular skillset chunks content into an array of "pages". For integrated vectorization, projection mappings control how chunks are mapped to fields in the index.
Limitations
Debug Sessions work with all generally available indexer data sources and most preview data sources, with the following exceptions:
Azure Cosmos DB for MongoDB indexer.
For the Azure Cosmos DB for NoSQL, if a row fails during index and there's no corresponding metadata, the debug session might not pick the correct row.
For the SQL API of Azure Cosmos DB, if a partitioned collection was previously non-partitioned, the debug session won't find the document.
For custom skills, a user-assigned managed identity isn't supported for a debug session connection to Azure Storage. As stated in the prerequisites, you can use a system managed identity, or specify a full access connection string that includes a key. For more information, see Connect a search service to other Azure resources using a managed identity.
Data sources with encryption enabled via customer managed keys (CMK).
Currently, the ability to select which document to debug is unavailable. This limitation isn't permanent and should be lifted soon. At this time, Debug Sessions selects the first document in the source data container or folder.
How a debug session works
When you start a session, the search service creates a copy of the skillset, indexer, and a data source containing a single document used to test the skillset. All session state is saved to a new blob container created by the Azure AI Search service in an Azure Storage account that you provide. The name of the generated container has a prefix of ms-az-cognitive-search-debugsession. The prefix is required because it mitigates the chance of accidentally exporting session data to another container in your account.
A cached copy of the enriched document and skillset is loaded into the visual editor so that you can inspect the content and metadata of the enriched document, with the ability to check each document node and edit any aspect of the skillset definition. Any changes made within the session are cached. Those changes won't affect the published skillset unless you commit them. Committing changes will overwrite the production skillset.
If the enrichment pipeline doesn't have any errors, a debug session can be used to incrementally enrich a document, test and validate each change before committing the changes.
Debug sessions help identify the root cause of errors or warnings by analyzing the data, skill inputs and outputs, and field mappings. If the indexer encounters configuration issues, such as incorrect network setup, permission-related access errors, or similar, please review the specific error message along with the linked documentation provided. For troubleshooting guidance, refer to the common indexer errors and warnings.
Debug Sessions with private connectivity
If your AI enrichment pipeline uses shared private links to access Azure resources, additional configuration is required to ensure indexer and debug sessions work correctly. This includes permissions, trusted access, and network setup.
- If you're using managed identity, assign the necessary roles to your search service identity, including
Storage Blob Data Contributor, so debug sessions can write session data to your storage account. - Ensure the search service has access to all resources referenced in the skillset definition, including any used in the debug session.
- In your storage account, enable trusted services to allow access from Azure AI Search.
- Set
"executionEnvironment" = "private"property in the indexer definition to ensure the indexer runs in a private context. - Create a shared private link for each resource accessed by the search service, including: your data source, if configured to indexer AI enrichment cache and knowledge store, and any other resources configured in your skillset.
- For other troubleshooting guidance, refer to the common indexer errors and warnings.
Debug session layout
The visual editor is organized into a surface area showing a progression of operations, starting with document cracking, followed by skills, mappings, and an index.
Select any skill or mapping, and a pane opens to side showing relevant information.
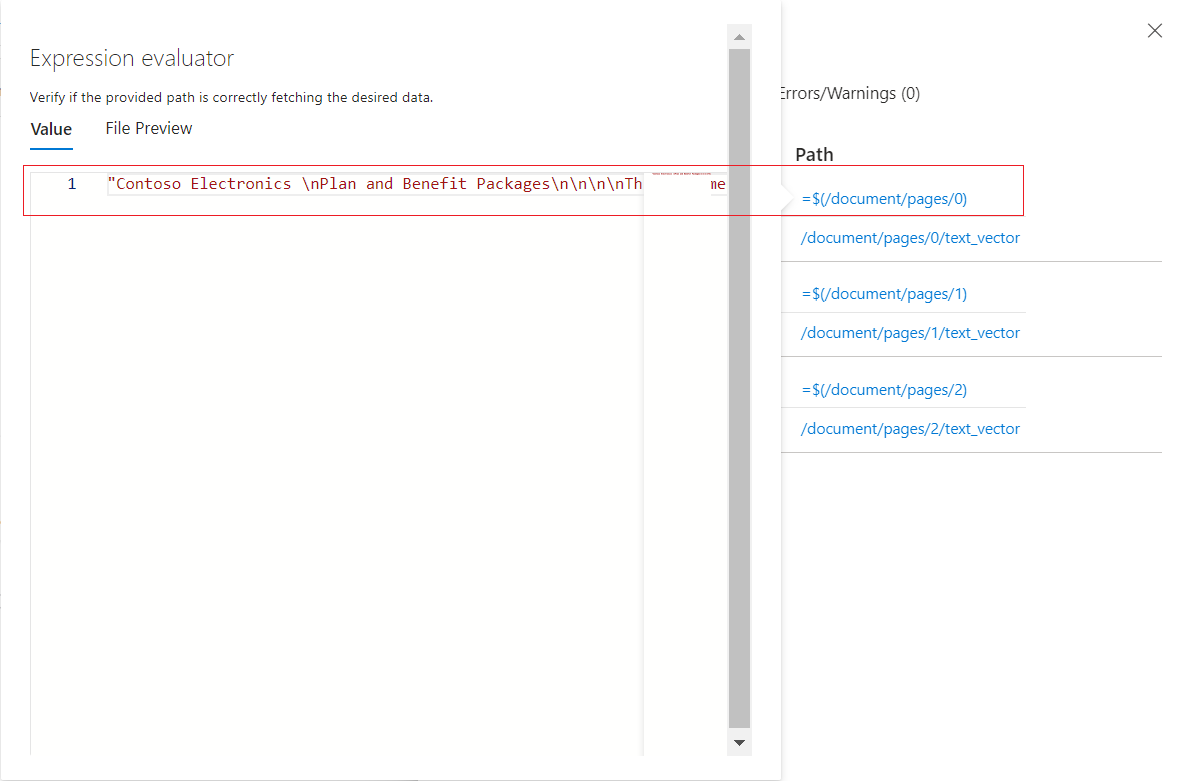
Follow the links to drill further into skills processing. For example, the following screenshot shows the output of the first iteration of the Text Split skill.
Skill details pane
The Skill details pane has the following sections:
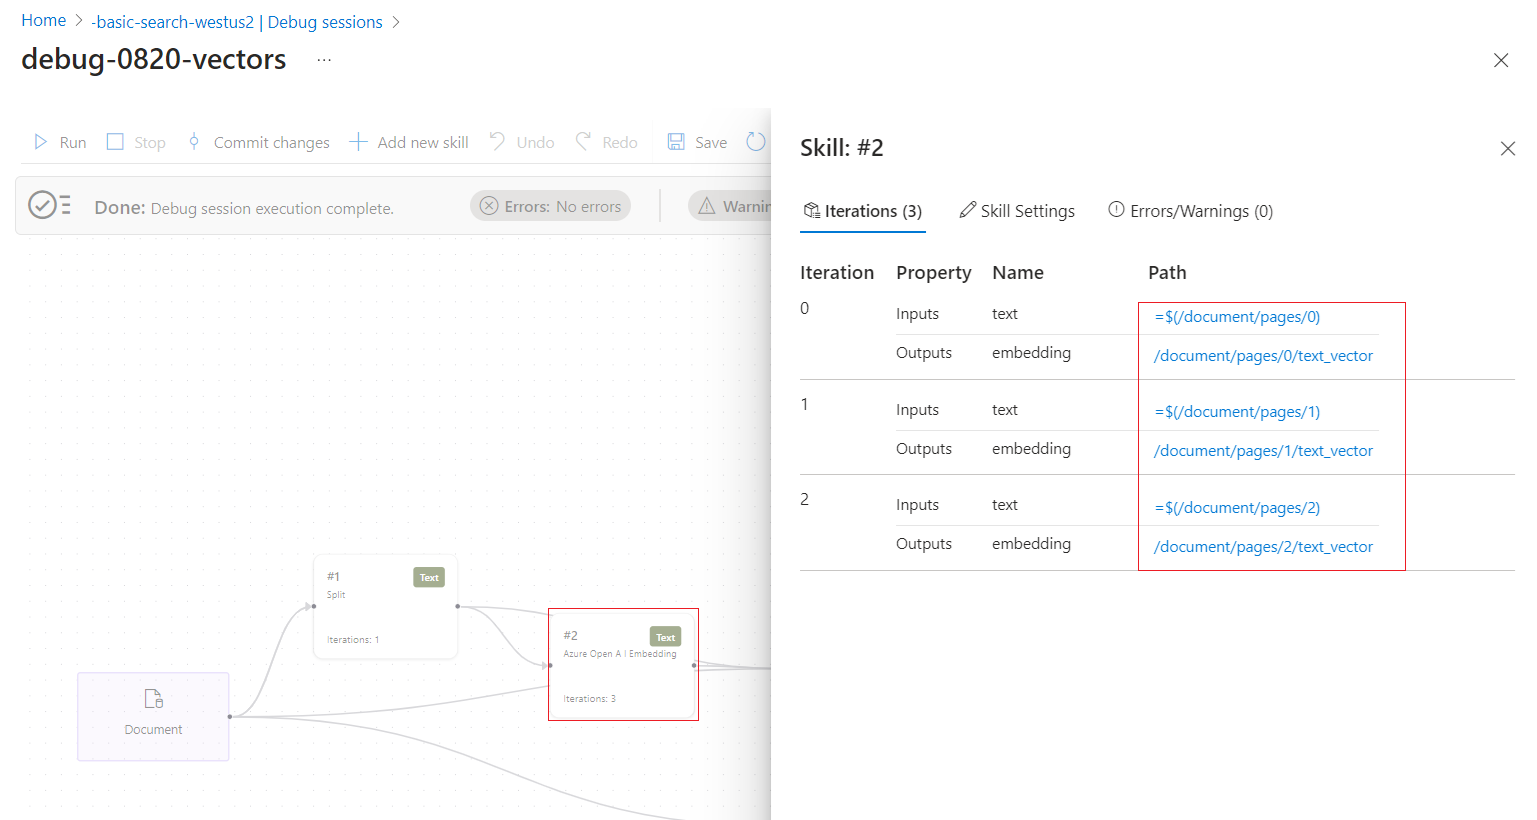
- Iterations: Shows you how many times a skill executes. You can check the inputs and outputs of each one.
- Skill Settings: View or edit the JSON skillset definition.
- Errors and warnings: Shows the errors or warnings specific to this skill.
Enriched data structure pane
The Enriched Data Structure pane slides out to the side when you select the blue show or hide arrow symbol. It's a human readable representation of what the enriched document contains. Previous screenshots in this article show examples of the enriched data structure.
Next steps
Now that you understand the elements of debug sessions, start your first debug session on an existing skillset.


