Note
Access to this page requires authorization. You can try signing in or changing directories.
Access to this page requires authorization. You can try changing directories.
This article explains how to measure query performance and volume using built-in metrics and diagnostic logging. It also explains how to get the query strings entered by application users.
The Azure portal shows basic metrics about query latency, query load (QPS), and throttling. Historical data that feeds into these metrics can be accessed in the Azure portal for 30 days. For longer retention, or to report on operational data and query strings, you must enable diagnostic logging and choose a storage option for persisting logged operations and metrics. We recommend Log Analytics workspace as a destination for logged operations. Kusto queries and data exploration target a Log Analytics workspace.
Conditions that maximize the integrity of data measurement include:
Use a billable service (a service created at either the Basic or a Standard tier). The free service is shared by multiple subscribers, which introduces a certain amount of volatility as loads shift.
Use a single replica and partition, if possible, to create a contained and isolated environment. If you use multiple replicas, query metrics are averaged across multiple nodes, which can lower the precision of results. Similarly, multiple partitions mean that data is divided, with the potential that some partitions might have different data if indexing is also underway. When you tune query performance, a single node and partition gives a more stable environment for testing.
Query volume (QPS)
Volume is measured as Search Queries Per Second (QPS), a built-in metric that can be reported as an average, count, minimum, or maximum values of queries that execute within a one-minute window. One-minute intervals (TimeGrain = "PT1M") for metrics is fixed within the system.
To learn more about the SearchQueriesPerSecond metric, see Search queries per second.
Query performance
Service-wide, query performance is measured as search latency and throttled queries.
Search latency
Search latency indicates how long a query takes to complete. To learn more about the SearchLatency metric, see Search latency.
Consider the following example of Search Latency metrics: 86 queries were sampled, with an average duration of 23.26 milliseconds. A minimum of 0 indicates some queries were dropped. The longest running query took 1000 milliseconds to complete. Total execution time was 2 seconds.

Throttled queries
Throttled queries refers to queries that are dropped instead of processed. In most cases, throttling is a normal part of running the service. It isn't necessarily an indication that there's something wrong. To learn more about the ThrottledSearchQueriesPercentage metric, see Throttled search queries percentage.
In the following screenshot, the first number is the count (or number of metrics sent to the log). Other aggregations, which appear at the top or when hovering over the metric, include average, maximum, and total. In this sample, no requests were dropped.

Explore metrics in the Azure portal
For a quick look at the current numbers, the Monitoring tab on the service Overview page shows three metrics (Search latency, Search queries per second (per search unit), Throttled Search Queries Percentage) over fixed intervals measured in hours, days, and weeks, with the option of changing the aggregation type.
For deeper exploration, open metrics explorer from the Monitoring menu so that you can layer, zoom in, and visualize data to explore trends or anomalies. Learn more about metrics explorer by completing this tutorial on creating a metrics chart.
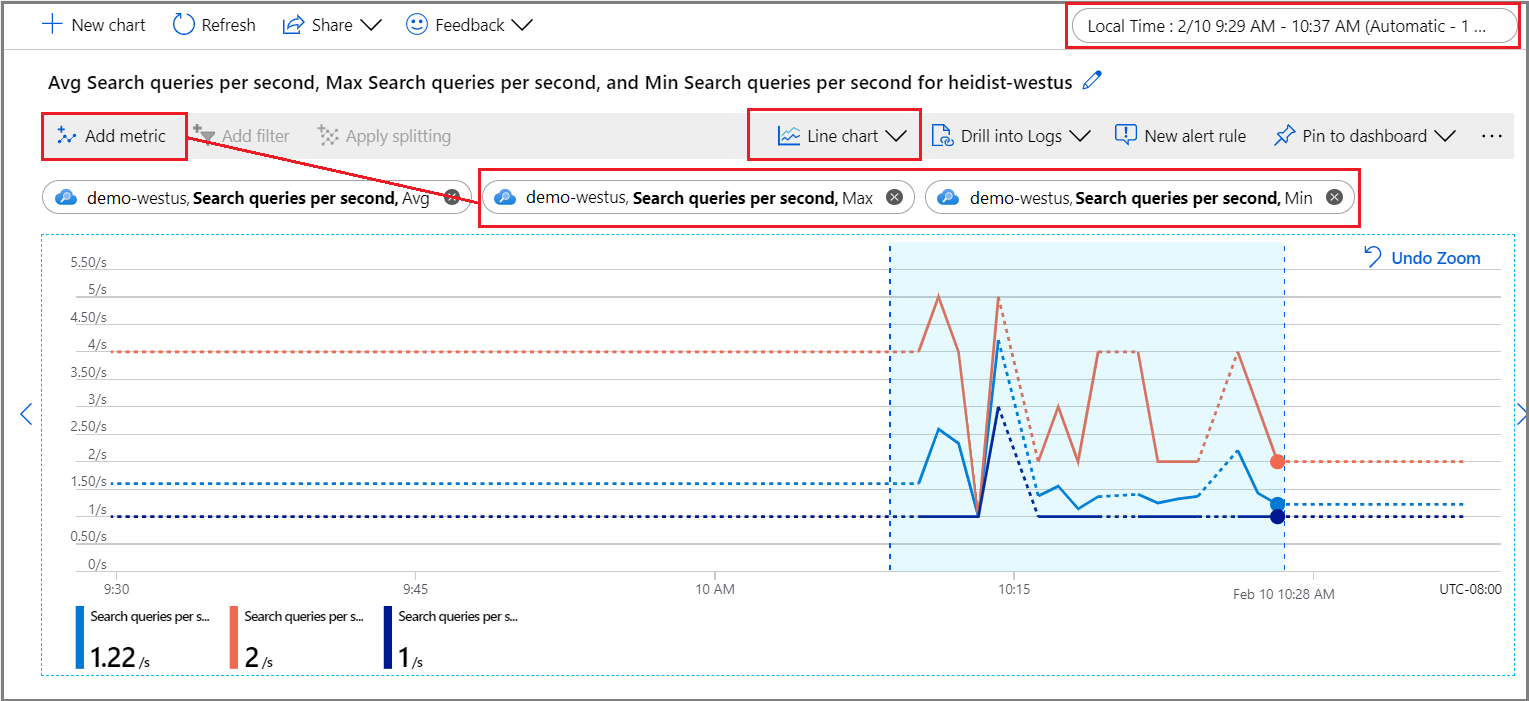
Under the Monitoring section, select Metrics to open the metrics explorer with the scope set to your search service.
Under Metric, choose one from the dropdown list and review the list of available aggregations for a preferred type. The aggregation defines how the collected values are sampled over each time interval.

In the top-right corner, set the time interval.
Choose a visualization. The default is a line chart.
Layer more aggregations by choosing Add metric and selecting different aggregations.
Zoom into an area of interest on the line chart. Put the mouse pointer at the beginning of the area, select and hold the left mouse button, drag to the other side of area, and release the button. The chart zooms in on that time range.
Return query strings entered by users
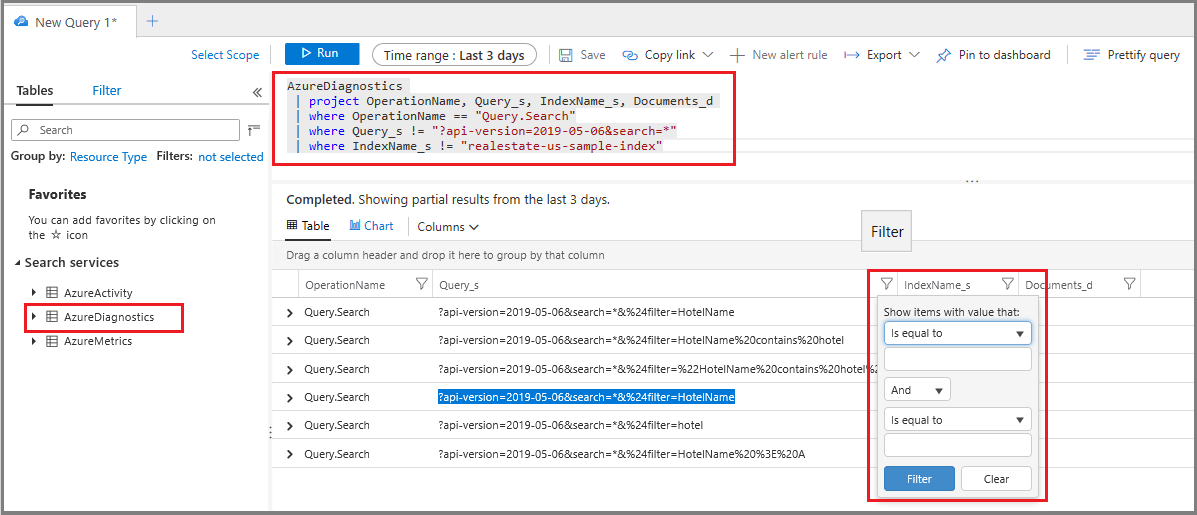
When you enable resource logging, the system captures query requests in the AzureDiagnostics table. As a prerequisite, you must have already specified a destination for logged operations, either a log analytics workspace or another storage option.
Under the Monitoring section, select Logs to open up an empty query window in Log Analytics.
Run the following expression to search
Query.Searchoperations, returning a tabular result set consisting of the operation name, query string, the index queried, and the number of documents found. The last two statements exclude query strings consisting of an empty or unspecified search, over a sample index, which cuts down the noise in your results.AzureDiagnostics | project OperationName, Query_s, IndexName_s, Documents_d | where OperationName == "Query.Search" | where Query_s != "?api-version=2025-09-01&search=*" | where IndexName_s != "hotels-sample-index"Optionally, set a Column filter on Query_s to search over a specific syntax or string. For example, you could filter over is equal to
?api-version=2025-09-01&search=*&%24filter=HotelName.
While this technique works for ad hoc investigation, building a report lets you consolidate and present the query strings in a layout more conducive to analysis.
Identify long-running queries
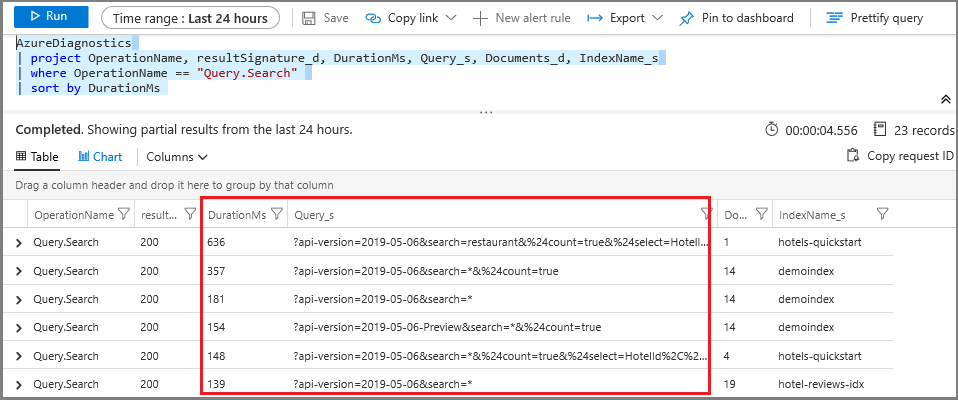
Add the duration column to get the numbers for all queries, not just those that are picked up as a metric. Sorting this data shows you which queries take the longest to complete.
Under the Monitoring section, select Logs to query for log information.
Run the following basic query to return queries, sorted by duration in milliseconds. The longest-running queries are at the top.
AzureDiagnostics
| project OperationName, resultSignature_d, DurationMs, Query_s, Documents_d, IndexName_s
| where OperationName == "Query.Search"
| sort by DurationMs
Create a metric alert
A metric alert establishes a threshold for sending a notification or triggering a corrective action that you define in advance. You can create alerts related to query execution, but you can also create them for resource health, search service configuration changes, skill execution, and document processing (indexing).
All thresholds are user-defined, so you should have an idea of what activity level should trigger the alert.
For query monitoring, it's common to create a metric alert for search latency and throttled queries. If you know when queries are dropped, you can look for remedies that reduce load or increase capacity. For example, if throttled queries increase during indexing, you could postpone it until query activity subsides.
If you're pushing the limits of a particular replica-partition configuration, setting up alerts for query volume thresholds (QPS) is also helpful.
Under Monitoring, select Alerts and then select Create alert rule.
Under Condition, select Add.
Configure signal logic. For signal type, choose metrics and then select the signal.
After selecting the signal, you can use a chart to visualize historical data for an informed decision on how to proceed with setting up conditions.
Next, scroll down to Alert logic. For proof-of-concept, you could specify an artificially low value for testing purposes.
Next, specify or create an Action Group. This is the response to invoke when the threshold is met. It might be a push notification or an automated response.
Last, specify Alert details. Name and describe the alert, assign a severity value, and specify whether to create the rule in an enabled or disabled state.
If you specified an email notification, you receive an email from "Azure" with a subject line of "Azure: Activated Severity: 3 <your rule name>".
Next steps
If you haven't done so already, review the fundamentals of search service monitoring to learn about the full range of oversight capabilities.