Note
Access to this page requires authorization. You can try signing in or changing directories.
Access to this page requires authorization. You can try changing directories.
Note
The Basic and Standard plans entered a retirement period on March 17, 2025. For more information, see the Azure Spring Apps retirement announcement.
Azure Metrics explorer is a component of the Azure portal that allows plotting charts, visually correlating trends, and investigating spikes and dips in metrics. Use the metrics explorer to investigate the health and utilization of your resources.
In an Azure Spring Apps instance, you can view metrics on the following pages:
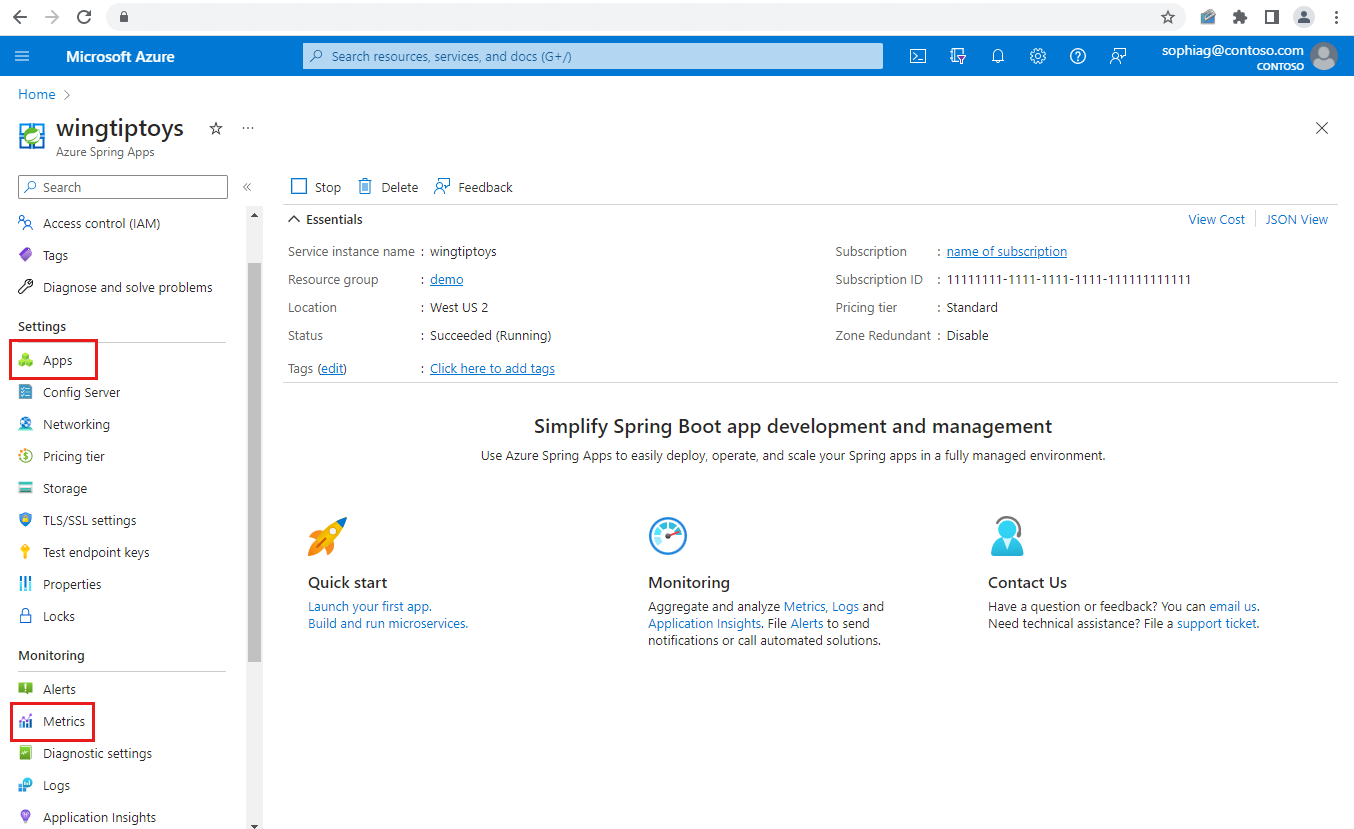
The application overview page, which shows quick status charts. To view this page, select Apps from the navigation pane, and then select an app.
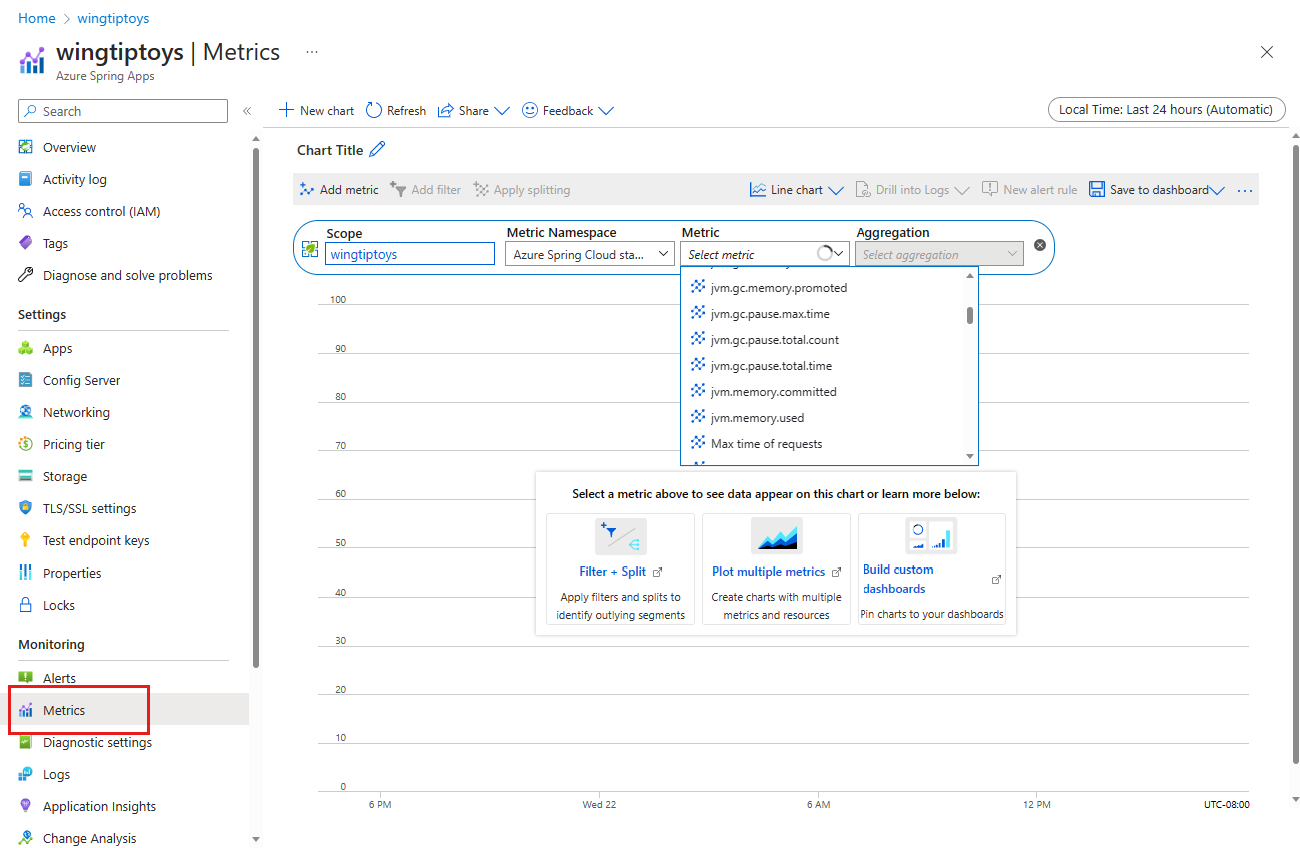
The common metrics page, which shows common metrics available to all apps in the Azure Spring Apps instance. To view this page, select Metrics from the navigation pane. You can build your own charts in the common metrics page and pin them to your Dashboard.
Application overview page
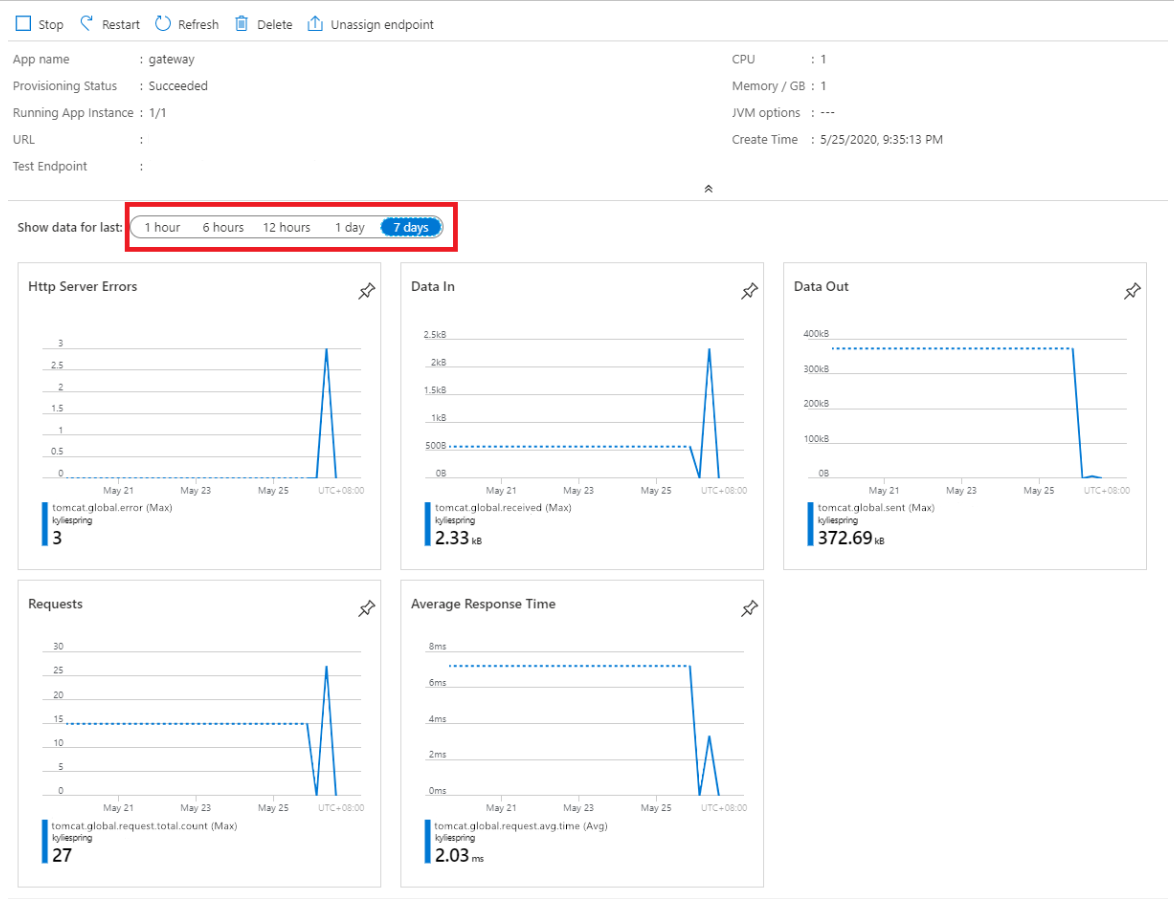
Select Apps in the navigation pane and then select an app from the list. The app overview page presents metrics charts that enable you to perform a quick status check of your application.
Azure Spring Apps provides these five charts with metrics that are updated every minute:
- Http Server Errors: Error count for HTTP requests to your app
- Data In: Bytes received by your app
- Data Out: Bytes sent by your app
- Requests: Requests received by your app
- Average Response Time: Average response time from your app
For the chart, you can select a time range from one hour to seven days.
Common metrics page
Select Metrics in the navigation pane to access common metrics. Select a metric to use from the Metric dropdown.
For metric details, see the User metric options section.
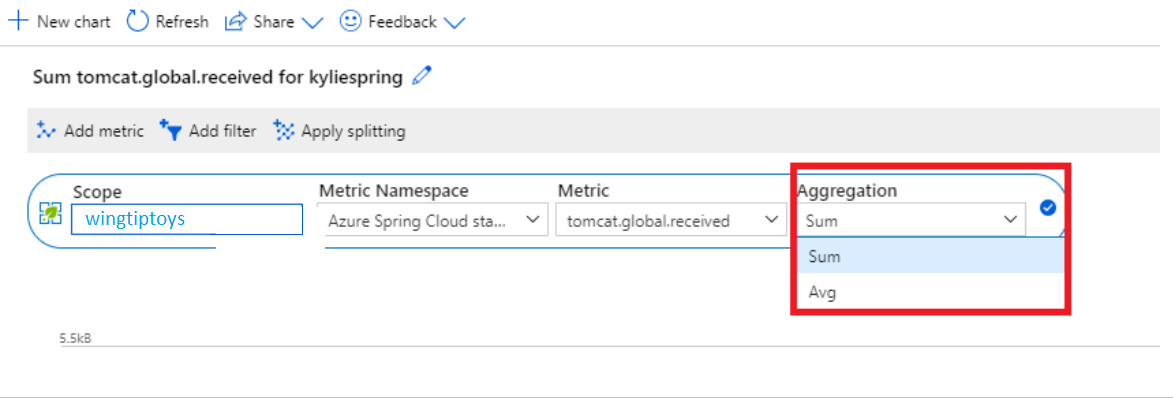
Next, select the aggregation type for each metric:
The aggregation type indicates how to aggregate metric points in the chart by time. There's one raw metric point every minute, and the pre-aggregation type within a minute is pre-defined by metrics type.
- Sum: Sum all values as target output.
- Average: Use the Average value in the period as target output.
- Max/Min: Use the Max/Min value in the period as target output.
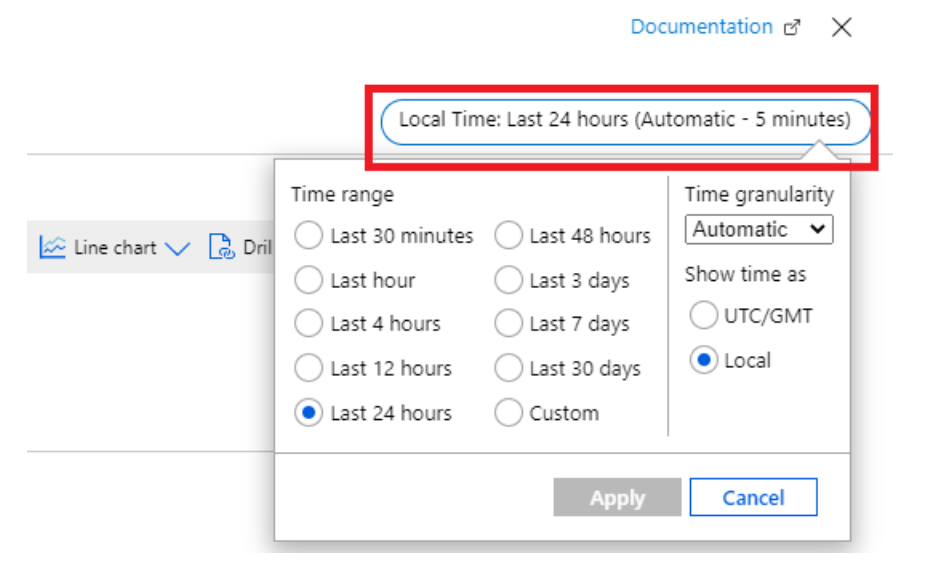
The time range can also be adjusted from last 30 minutes to last 30 days or a custom time range.
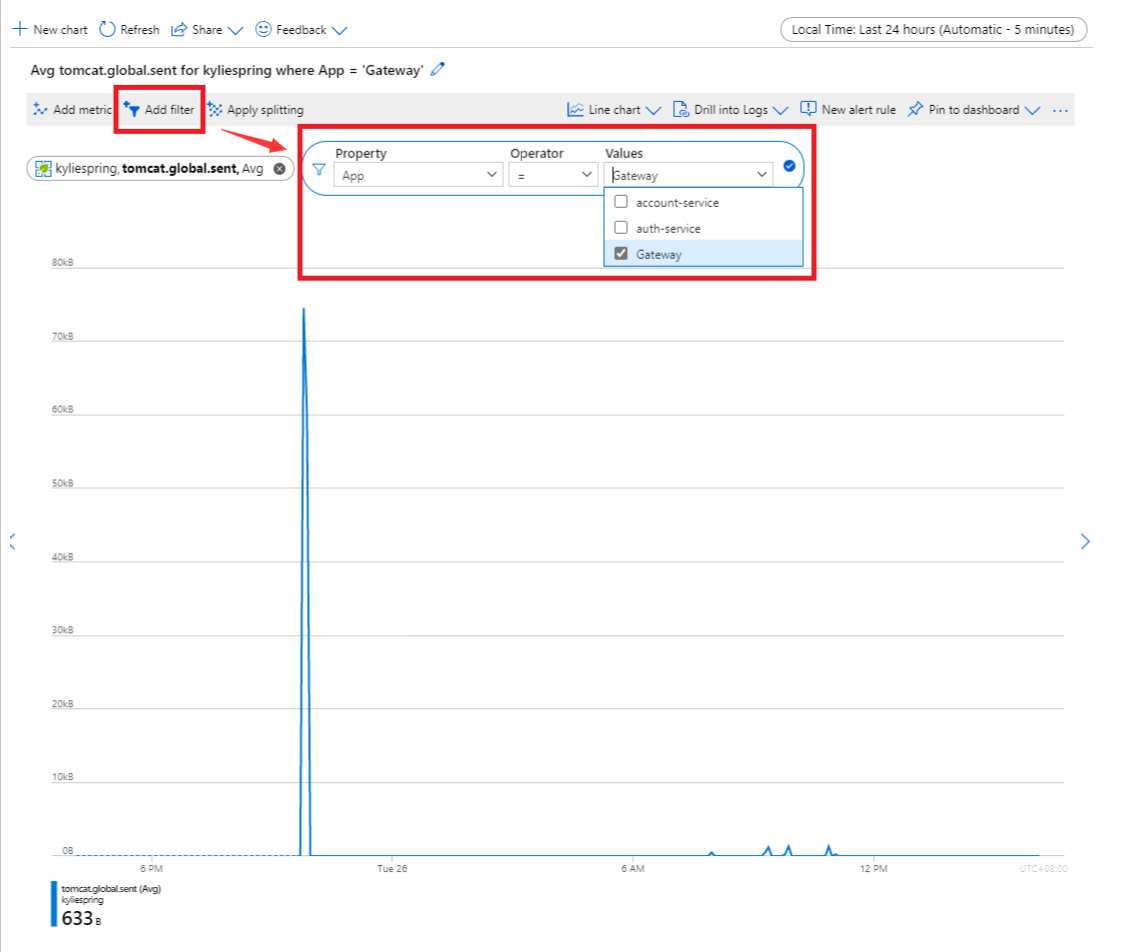
The default view includes all of an Azure Spring Apps service's application's metrics together. Metrics of one app or instance can be filtered in the display. Select Add filter, set the property to App, and select the target application you want to monitor in the Values text box.
You can use two kinds of filters (properties):
- App: filter by app name
- Instance: filter by app instance
- Deployment: filter by deployment name
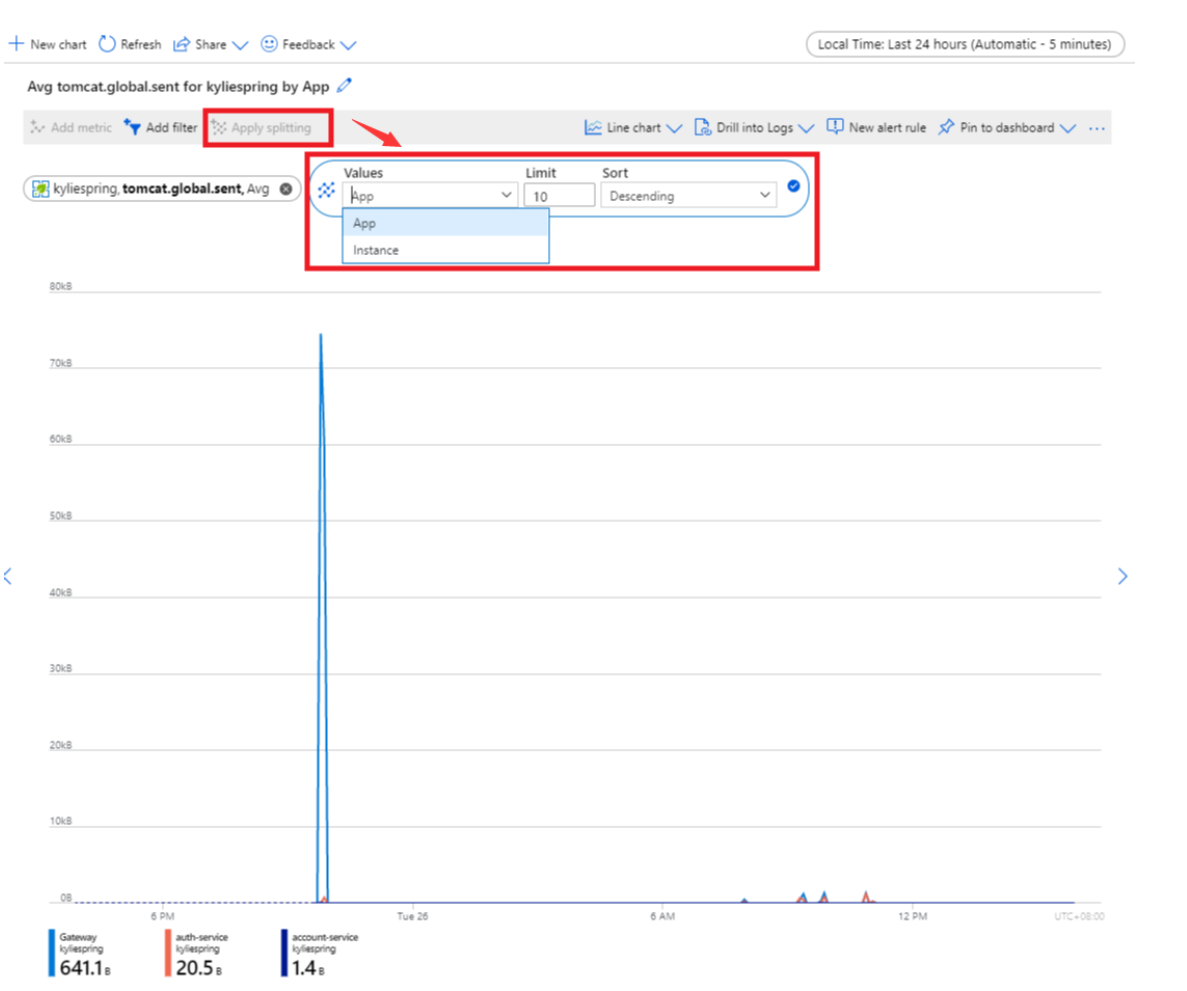
You can also use the Apply splitting option, which draws multiple lines for one app:
Tip
You can build your own charts on the metrics page and pin them to your Dashboard. Start by naming your chart. Next, select Pin to dashboard in the top right corner. You can now check on your application at your Portal Dashboard.
User metrics options
Note
For Spring Boot applications, to see metrics from Spring Boot Actuator, add the spring-boot-starter-actuator dependency. For more information, see the Add actuator dependency section of Manage and monitor app with Spring Boot Actuator.
The following tables show the available metrics and details.
Error
| Name | Spring Boot Actuator metric name | Unit | Description |
|---|---|---|---|
tomcat.global.error |
tomcat.global.error |
Count | Number of errors that occurred in processed requests. |
Performance
| Name | Spring Boot Actuator metric name | Unit | Description |
|---|---|---|---|
system.cpu.usage |
system.cpu.usage |
Percent | [Obsolete] Recent CPU usage for the whole system. This metric is deprecated because the accuracy isn't reliable. Use App CPU Usage instead. The value is a double in the [0.0,1.0] interval. A value of 0.0 means that all CPUs were idle during the recent period of time observed, while a value of 1.0 means that all CPUs were actively running 100% of the time during the recent period being observed. |
process.cpu.usage |
App CPU Usage Percentage | Percent | [Obsolete] Recent CPU usage for the Java Virtual Machine process. The metric is deprecated because the accuracy isn't reliable. Use App CPU Usage instead. The value is a double in the [0.0,1.0] interval. A value of 0.0 means that none of the CPUs were running threads from the JVM process during the recent period of time observed, while a value of 1.0 means that all CPUs were actively running threads from the JVM 100% of the time during the recent period being observed. Threads from the JVM include the application threads as well as the JVM internal threads. |
| App CPU Usage | Percent | The ratio of CPU time used in cores to the total CPU limit. It represents the proportion of CPU resources consumed by a k8s container, mainly for the JVM process. This value is a double in the [0.0,1.0] interval. A value of 0.0 means that none of the CPUs were running threads from the JVM process during the recent period of time observed, while a value of 1.0 means that all CPUs were actively running threads from the JVM 100% of the time during the recent period being observed. Threads from the JVM include the application threads as well as the JVM internal threads. | |
| App CPU Usage (Deprecated) | Percent | Deprecated metric of App CPU Usage. Use the new App CPU Usage metric instead. | |
| App Memory Usage | Percent | Recent memory usage of the JVM process against the memory allocated to this app. This value is a double in the [0.0,1.0] interval. A value of 0.0 means that none of the memory was allocated by threads from the JVM process during the recent period of time observed, while a value of 1.0 means that all memory was allocated by threads from the JVM 100% of the time during the recent period being observed. Threads from the JVM include the application threads as well as the JVM internal threads. | |
jvm.memory.committed |
jvm.memory.committed |
Bytes | Represents the amount of memory that is guaranteed to be available for use by the JVM. The JVM may release memory to the system and committed could be less than init. committed will always be greater than or equal to used. |
jvm.memory.used |
jvm.memory.used |
Bytes | Represents the amount of memory currently used in bytes. |
jvm.memory.max |
jvm.memory.max |
Bytes | Represents the maximum amount of memory that can be used for memory management. The amount of used and committed memory will always be less than or equal to max if max is defined. A memory allocation may fail if it attempts to increase the used memory such that used > committed even if used <= max would still be true (for example, when the system is low on virtual memory). |
jvm.gc.max.data.size |
jvm.gc.max.data.size |
Bytes | The peak memory usage of the old generation memory pool since the Java virtual machine was started. |
jvm.gc.live.data.size |
jvm.gc.live.data.size |
Bytes | Size of old generation memory pool after a full garbage collection (GC). |
jvm.gc.memory.promoted |
jvm.gc.memory.promoted |
Bytes | Count of positive increases in the size of the old generation memory pool before GC to after GC. |
jvm.gc.memory.allocated |
jvm.gc.memory.allocated |
Bytes | Incremented for an increase in the size of the young generation memory pool after one GC to before the next. |
jvm.gc.pause.total.count |
jvm.gc.pause (total-count) |
Count | Total GC count after this JMV started, including Young and Old GC. |
jvm.gc.pause.total.time |
jvm.gc.pause (total-time) |
Milliseconds | Total GC time consumed after this JMV started, including Young and Old GC. |
Performance (.NET)
| Name | Spring Boot Actuator metric name | Unit | Description |
|---|---|---|---|
| CPU usage | cpu-usage |
Percent | The percent of the process's CPU usage relative to all of the system CPU resources [0-100]. |
| Working set | working-set |
Megabytes | Amount of working set used by the process. |
| GC heap size | gc-heap-size |
Megabytes | Total heap size reported by the garbage collector. |
| Gen 0 GC count | gen-0-gc-count |
Count | Number of Generation 0 garbage collections per second. |
| Gen 1 GC count | gen-1-gc-count |
Count | Number of Generation 1 garbage collections per second. |
| Gen 2 GC count | gen-2-gc-count |
Count | Number of Generation 2 garbage collections per second. |
| Time in GC | timein-gc |
Percent | The percent of time in garbage collection since the last garbage collection. |
| Gen 0 heap size | gen-0-size |
Bytes | Generation 0 heap size. |
| Gen 1 heap size | gen-1-size |
Bytes | Generation 1 heap size. |
| Gen 2 heap size | gen-2-size |
Bytes | Generation 2 heap size. |
| LOH heap size | loh-size |
Bytes | Large Object Heap heap size. |
| Allocation rate | alloc-rate |
Bytes | Number of bytes allocated per second. |
| Assembly count | assembly-count |
Count | Number of assemblies loaded. |
| Exception count | exception-count |
Count | Number of exceptions per second. |
| Thread pool thread count | threadpool-thread-count |
Count | Number of thread pool threads. |
| Monitor lock contention count | monitor-lock-contention-count |
Count | The number of times per second there was contention when trying to take a monitor's lock. |
| Thread pool queue length | threadpool-queue-length |
Count | Thread pool work items queue length. |
| Thread pool completed items count | threadpool-completed-items-count |
Count | Thread pool completed work items count. |
| Active timers count | active-timer-count |
Count | The number of timers that are currently active. An active timer is one that is registered to tick at some point in the future, and has not yet been canceled. |
For more information, see Investigate performance counters (dotnet-counters).
Request
| Name | Spring Boot Actuator metric name | Unit | Description |
|---|---|---|---|
tomcat.global.sent |
tomcat.global.sent |
Bytes | Amount of data Tomcat web server sent. |
tomcat.global.received |
tomcat.global.received |
Bytes | Amount of data Tomcat web server received. |
tomcat.global.request.total.count |
tomcat.global.request (total-count) |
Count | Total count of Tomcat web server processed requests. |
tomcat.global.request.max |
tomcat.global.request.max |
Milliseconds | Maximum time of Tomcat web server to process a request. |
Request (.NET)
| Name | Spring Boot Actuator metric name | Unit | Description |
|---|---|---|---|
| Requests per second | requests-per-second |
Count | Request rate. |
| Total requests | total-requests |
Count | Total number of requests. |
| Current requests | current-requests |
Count | Number of current requests. |
| Failed requests | failed-requests |
Count | Number of failed requests. |
For more information, see Investigate performance counters (dotnet-counters).
Session
| Name | Spring Boot Actuator metric name | Unit | Description |
|---|---|---|---|
tomcat.sessions.active.max |
tomcat.sessions.active.max |
Count | Maximum number of sessions that have been active at the same time. |
tomcat.sessions.alive.max |
tomcat.sessions.alive.max |
Milliseconds | Longest time (in seconds) that an expired session was alive. |
tomcat.sessions.created |
tomcat.sessions.created |
Count | Number of sessions that have been created. |
tomcat.sessions.expired |
tomcat.sessions.expired |
Count | Number of sessions that have expired. |
tomcat.sessions.rejected |
tomcat.sessions.rejected |
Count | Number of sessions that were not created because the maximum number of active sessions reached. |
tomcat.sessions.active.current |
tomcat.sessions.active.current |
Count | Tomcat Session Active Count. |
Ingress
| Display name | Azure metric name | Unit | Description |
|---|---|---|---|
| Bytes Received | IngressBytesReceived |
Bytes | Count of bytes received by Azure Spring Apps from the clients. |
| Bytes Sent | IngressBytesSent |
Bytes | Count of bytes sent by Azure Spring Apps to the clients. |
| Requests | IngressRequests |
Count | Count of requests by Azure Spring Apps from the clients. |
| Failed Requests | IngressFailedRequests |
Count | Count of failed requests by Azure Spring Apps from the clients. |
| Response Status | IngressResponseStatus |
Count | HTTP response status returned by Azure Spring Apps. The response status code distribution can be further categorized to show responses in 2xx, 3xx, 4xx, and 5xx categories. |
| Response Time | IngressResponseTime |
Seconds | Http response time return by Azure Spring Apps. |
| Throughput In (bytes/s) | IngressBytesReceivedRate |
BytesPerSecond | Bytes received per second by Azure Spring Apps from the clients. |
| Throughput Out (bytes/s) | IngressBytesSentRate |
BytesPerSecond | Bytes sent per second by Azure Spring Apps to the clients. |
