Note
Access to this page requires authorization. You can try signing in or changing directories.
Access to this page requires authorization. You can try changing directories.
Overview
In this tutorial, you will learn how to integrate your existing on-premises Prometheus server with Azure Synapse workspace for near real-time Apache Spark application metrics using the Synapse Prometheus connector.
This tutorial also introduces the Azure Synapse REST metrics APIs. You can fetch Apache Spark application metrics data through the REST APIs to build your own monitoring and diagnosis toolkit or integrate with your monitoring systems.
Use Azure Synapse Prometheus connector for your on-premises Prometheus servers
Azure Synapse Prometheus connector is an open-source project. The Synapse Prometheus connector uses a file-based service discovery method to allow you to:
- Authenticate to Synapse workspace via a Microsoft Entra service principal.
- Fetch workspace Apache Spark applications list.
- Pull Apache Spark application metrics through Prometheus file-based configuration.
1. Prerequisite
You need to have a Prometheus server deployed on a Linux VM.
2. Create a service principal
To use the Azure Synapse Prometheus connector in your on-premises Prometheus server, you should follow the steps below to create a service principal.
2.1 Create a service principal:
az ad sp create-for-rbac --name <service_principal_name> --role Contributor --scopes /subscriptions/<subscription_id>
The result should look like:
{
  "appId": "abcdef...",
  "displayName": "<service_principal_name>",
  "name": "http://<service_principal_name>",
  "password": "abc....",
  "tenant": "<tenant_id>"
}
Note down the appId, password, and tenant ID.
2.2 Add corresponding permissions to the service principal created in the above step.
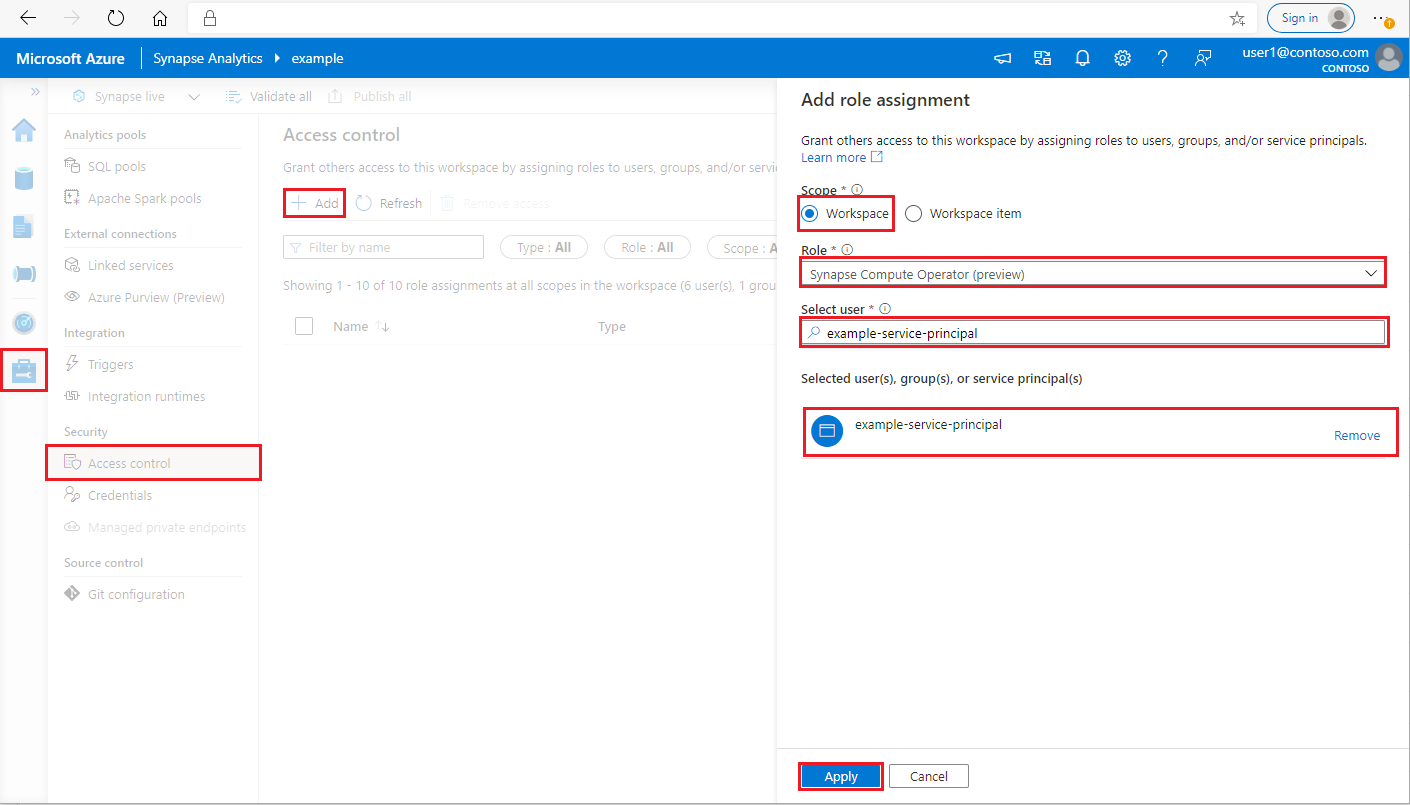
Log in to your Azure Synapse Analytics workspace as Synapse Administrator
In Synapse Studio, on the left-side pane, select Manage > Access control
Click the Add button on the upper left to add a role assignment
For Scope, choose Workspace
For Role, choose Synapse Compute Operator
For Select user, input your <service_principal_name> and click your service principal
Click Apply (Wait 3 minutes for permission to take effect.)
3. Download the Azure Synapse Prometheus Connector
Use the commands to install the Azure Synapse Prometheus Connector.
git clone https://github.com/microsoft/azure-synapse-spark-metrics.git
cd ./azure-synapse-spark-metrics/synapse-prometheus-connector/src
python pip install -r requirements.txt
4. Create a config file for Azure Synapse workspaces
Create a config.yaml file in config folder, and fill in the following fields: workspace_name, tenant_id, service_principal_name and service_principal_password. You can add multiple workspaces in the yaml config.
workspaces:
  - workspace_name: <your_workspace_name>
    tenant_id: <tenant_id>
    service_principal_name: <service_principal_app_id>
    service_principal_password: "<service_principal_password>"
    synapse_host_suffix: "dev.azuresynapse.azure.cn"
    resource_uri: https://dev.azuresynapse.azure.cn
5. Update the Prometheus config
Add following config section in your Prometheus scrape_config, and replace the <your_workspace_name> to your workspace name and the <path_to_synapse_connector> to your cloned synapse-prometheus-connector folder
- job_name: synapse-prometheus-connector
  static_configs:
  - labels:
      __metrics_path__: /metrics
      __scheme__: http
    targets:
    - localhost:8000
- job_name: synapse-workspace-<your_workspace_name>
  bearer_token_file: <path_to_synapse_connector>/output/workspace/<your_workspace_name>/bearer_token
  file_sd_configs:
  - files:
    - <path_to_synapse_connector>/output/workspace/<your_workspace_name>/application_discovery.json
    refresh_interval: 10s
  metric_relabel_configs:
  - source_labels: [ __name__ ]
    target_label: __name__
    regex: metrics_application_[0-9]+_[0-9]+_(.+)
    replacement: spark_$1
  - source_labels: [ __name__ ]
    target_label: __name__
    regex: metrics_(.+)
    replacement: spark_$1
6. Start the connector in the Prometheus server VM
Start a connector server in the Prometheus server VM as follows.
python main.py
Wait for a few seconds and the connector should start working. And you can see the "synapse-prometheus-connector" in the Prometheus service discovery page.
Use Azure Synapse Prometheus or REST metrics APIs to collect metrics data
1. Authentication
You can use the client credentials flow to get an access token. To access the metrics API, you should get a Microsoft Entra access token for the service principal, which has proper permission to access the APIs.
| Parameter | Required | Description |
|---|---|---|
| tenant_id | True | Your Azure service principal (application) tenant ID |
| grant_type | True | Specifies the requested grant type. In a Client Credentials Grant flow, the value must be client_credentials. |
| client_id | True | The application (service principal) ID of the application you registered in Azure portal or Azure CLI. |
| client_secret | True | The secret generated for the application (service principal) |
| resource | True | Synapse resource uri, should be 'https://dev.azuresynapse.azure.cn' |
curl -X GET -H 'Content-Type: application/x-www-form-urlencoded' \
  -d 'grant_type=client_credentials&client_id=<service_principal_app_id>&resource=<azure_synapse_resource_id>&client_secret=<service_principal_secret>' \
  https://login.partner.microsoftonline.cn/<tenant_id>/oauth2/token
Response looks like:
{
  "token_type": "Bearer",
  "expires_in": "599",
  "ext_expires_in": "599",
  "expires_on": "1575500666",
  "not_before": "1575499766",
  "resource": "2ff8...f879c1d",
  "access_token": "ABC0eXAiOiJKV1Q......un_f1mSgCHlA"
}
2. List running applications in the Azure Synapse workspace
To get list of Apache Spark applications for a Synapse workspace, you can follow this document Monitoring - Get Apache Spark Job List.
3. Collect Apache Spark application metrics with the Prometheus or REST APIs
Collect Apache Spark application metrics with the Prometheus API
Get latest metrics of the specified Apache Spark application by Prometheus API
GET https://{endpoint}/livyApi/versions/{livyApiVersion}/sparkpools/{sparkPoolName}/sessions/{sessionId}/applications/{sparkApplicationId}/metrics/executors/prometheus?format=html
| Parameter | Required | Description |
|---|---|---|
| endpoint | True | The workspace development endpoint, for example https://myworkspace.dev.azuresynapse.azure.cn. |
| livyApiVersion | True | Valid api-version for the request. Currently, it is 2019-11-01-preview |
| sparkPoolName | True | Name of the spark pool. |
| sessionId | True | Identifier for the session. |
| sparkApplicationId | True | Spark Application ID |
Sample Request:
GET https://myworkspace.dev.azuresynapse.azure.cn/livyApi/versions/2019-11-01-preview/sparkpools/mysparkpool/sessions/1/applications/application_1605509647837_0001/metrics/executors/prometheus?format=html
Sample Response:
Status code: 200 Response looks like:
metrics_executor_rddBlocks{application_id="application_1605509647837_0001", application_name="mynotebook_mysparkpool_1605509570802", executor_id="driver"} 0
metrics_executor_memoryUsed_bytes{application_id="application_1605509647837_0001", application_name="mynotebook_mysparkpool_1605509570802", executor_id="driver"} 74992
metrics_executor_diskUsed_bytes{application_id="application_1605509647837_0001", application_name="mynotebook_mysparkpool_1605509570802", executor_id="driver"} 0
metrics_executor_totalCores{application_id="application_1605509647837_0001", application_name="mynotebook_mysparkpool_1605509570802", executor_id="driver"} 0
metrics_executor_maxTasks{application_id="application_1605509647837_0001", application_name="mynotebook_mysparkpool_1605509570802", executor_id="driver"} 0
metrics_executor_activeTasks{application_id="application_1605509647837_0001", application_name="mynotebook_mysparkpool_1605509570802", executor_id="driver"} 1
metrics_executor_failedTasks_total{application_id="application_1605509647837_0001", application_name="mynotebook_mysparkpool_1605509570802", executor_id="driver"} 0
metrics_executor_completedTasks_total{application_id="application_1605509647837_0001", application_name="mynotebook_mysparkpool_1605509570802", executor_id="driver"} 2
...
Collect Apache Spark application metrics with the REST API
GET https://{endpoint}/livyApi/versions/{livyApiVersion}/sparkpools/{sparkPoolName}/sessions/{sessionId}/applications/{sparkApplicationId}/executors
| Parameter | Required | Description |
|---|---|---|
| endpoint | True | The workspace development endpoint, for example https://myworkspace.dev.azuresynapse.azure.cn. |
| livyApiVersion | True | Valid api-version for the request. Currently, it is 2019-11-01-preview |
| sparkPoolName | True | Name of the spark pool. |
| sessionId | True | Identifier for the session. |
| sparkApplicationId | True | Spark Application ID |
Sample Request
GET https://myworkspace.dev.azuresynapse.azure.cn/livyApi/versions/2019-11-01-preview/sparkpools/mysparkpool/sessions/1/applications/application_1605509647837_0001/executors
Sample Response Status code: 200
[
    {
        "id": "driver",
        "hostPort": "f98b8fc2aea84e9095bf2616208eb672007bde57624:45889",
        "isActive": true,
        "rddBlocks": 0,
        "memoryUsed": 75014,
        "diskUsed": 0,
        "totalCores": 0,
        "maxTasks": 0,
        "activeTasks": 0,
        "failedTasks": 0,
        "completedTasks": 0,
        "totalTasks": 0,
        "totalDuration": 0,
        "totalGCTime": 0,
        "totalInputBytes": 0,
        "totalShuffleRead": 0,
        "totalShuffleWrite": 0,
        "isBlacklisted": false,
        "maxMemory": 15845975654,
        "addTime": "2020-11-16T06:55:06.718GMT",
        "executorLogs": {
            "stdout": "http://f98b8fc2aea84e9095bf2616208eb672007bde57624:8042/node/containerlogs/container_1605509647837_0001_01_000001/trusted-service-user/stdout?start=-4096",
            "stderr": "http://f98b8fc2aea84e9095bf2616208eb672007bde57624:8042/node/containerlogs/container_1605509647837_0001_01_000001/trusted-service-user/stderr?start=-4096"
        },
        "memoryMetrics": {
            "usedOnHeapStorageMemory": 75014,
            "usedOffHeapStorageMemory": 0,
            "totalOnHeapStorageMemory": 15845975654,
            "totalOffHeapStorageMemory": 0
        },
        "blacklistedInStages": []
    },
    // ...
]
4. Build your own diagnosis and monitoring tools
The Prometheus API and the REST APIs provide rich metrics data about the Apache Spark application running information.You can collect the application-related metrics data through the Prometheus API and the REST APIs. And build your own diagnosis and monitoring tools that are more suitable for your needs.