Note
Access to this page requires authorization. You can try signing in or changing directories.
Access to this page requires authorization. You can try changing directories.
In this tutorial, you learn how to perform exploratory data analysis using existing open datasets, with no storage setup required. You combine different Azure Open Datasets using serverless SQL pool. You then visualize the results in Synapse Studio for Azure Synapse Analytics.
In this tutorial, you:
- Access the built-in serverless SQL pool
- Access Azure Open Datasets to use tutorial data
- Perform basic data analysis using SQL
Access the serverless SQL pool
Every workspace comes with a preconfigured serverless SQL pool for you to use called Built-in. To access it:
- Open your workspace and select the Develop hub.
- Select the + Add new resource button.'
- Select SQL script.
You can use this script to explore your data without having to reserve SQL capacity.
If you don't have an Azure subscription, create a trial account before you begin.
Access the tutorial data
All the data we use in this tutorial is housed in the storage account azureopendatastorage, which holds Azure Open Datasets for open use in tutorials like this one. You can run all the scripts as-is directly from your workspace as long as your workspace can access a public network.
This tutorial uses a dataset about New York City (NYC) Taxi:
- Pick-up and drop-off dates and times
- Pick-up and drop-off locations
- Trip distances
- Itemized fares
- Rate types
- Payment types
- Driver-reported passenger counts
The OPENROWSET(BULK...) function allows you to access files in Azure Storage. [OPENROWSET](develop-openrowset.md) reads content of a remote data source, such as a file, and returns the content as a set of rows.
To get familiar with the NYC Taxi data, run the following query:
SELECT TOP 100 * FROM
    OPENROWSET(
        BULK 'https://azureopendatastorage.blob.core.windows.net/nyctlc/yellow/puYear=*/puMonth=*/*.parquet',
        FORMAT='PARQUET'
    ) AS [nyc]
Other accessible datasets
Similarly, you can query the Public Holidays dataset by using the following query:
SELECT TOP 100 * FROM
    OPENROWSET(
        BULK 'https://azureopendatastorage.blob.core.windows.net/holidaydatacontainer/Processed/*.parquet',
        FORMAT='PARQUET'
    ) AS [holidays]
You can also query the Weather Data dataset by using the following query:
SELECT
    TOP 100 *
FROM
    OPENROWSET(
        BULK 'https://azureopendatastorage.blob.core.windows.net/isdweatherdatacontainer/ISDWeather/year=*/month=*/*.parquet',
        FORMAT='PARQUET'
    ) AS [weather]
You can learn more about the meaning of the individual columns in the descriptions of the data sets:
Automatic schema inference
Since the data is stored in the Parquet file format, automatic schema inference is available. You can query the data without listing the data types of all columns in the files. You also can use the virtual column mechanism and the filepath function to filter out a certain subset of files.
Note
The default collation is SQL_Latin1_General_CP1_CI_ASIf. For a non-default collation, take into account case sensitivity.
If you create a database with case sensitive collation when you specify columns, make sure to use correct name of the column.
A column name tpepPickupDateTime would be correct while tpeppickupdatetime wouldn't work in a non-default collation.
Time series, seasonality, and outlier analysis
You can summarize the yearly number of taxi rides by using the following query:
SELECT
    YEAR(tpepPickupDateTime) AS current_year,
    COUNT(*) AS rides_per_year
FROM
    OPENROWSET(
        BULK 'https://azureopendatastorage.blob.core.windows.net/nyctlc/yellow/puYear=*/puMonth=*/*.parquet',
        FORMAT='PARQUET'
    ) AS [nyc]
WHERE nyc.filepath(1) >= '2009' AND nyc.filepath(1) <= '2019'
GROUP BY YEAR(tpepPickupDateTime)
ORDER BY 1 ASC
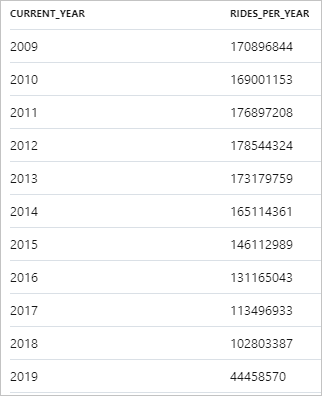
The following snippet shows the result for the yearly number of taxi rides:

The data can be visualized in Synapse Studio by switching from the Table to the Chart view. You can choose among different chart types, such as Area, Bar, Column, Line, Pie, and Scatter. In this case, plot the Column chart with the Category column set to current_year:

From this visualization, you can see a trend of decreasing ride numbers over the years. Presumably, this decrease is due to the recent increased popularity of ride-sharing companies.
Note
At the time of writing this tutorial, data for 2019 is incomplete. As a result, there's a huge drop in the number of rides for that year.
You can focus the analysis on a single year, for example, 2016. The following query returns the daily number of rides during that year:
SELECT
    CAST([tpepPickupDateTime] AS DATE) AS [current_day],
    COUNT(*) as rides_per_day
FROM
    OPENROWSET(
        BULK 'https://azureopendatastorage.blob.core.windows.net/nyctlc/yellow/puYear=*/puMonth=*/*.parquet',
        FORMAT='PARQUET'
    ) AS [nyc]
WHERE nyc.filepath(1) = '2016'
GROUP BY CAST([tpepPickupDateTime] AS DATE)
ORDER BY 1 ASC
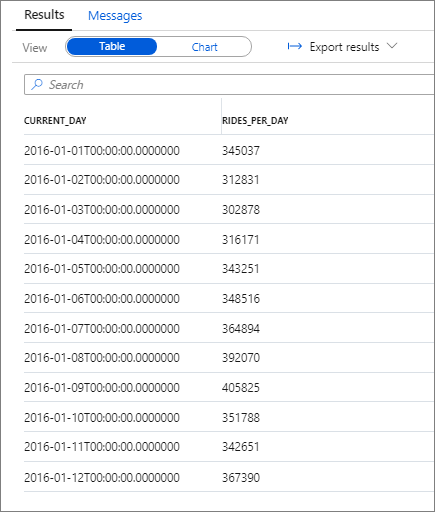
The following snippet shows the result for this query:

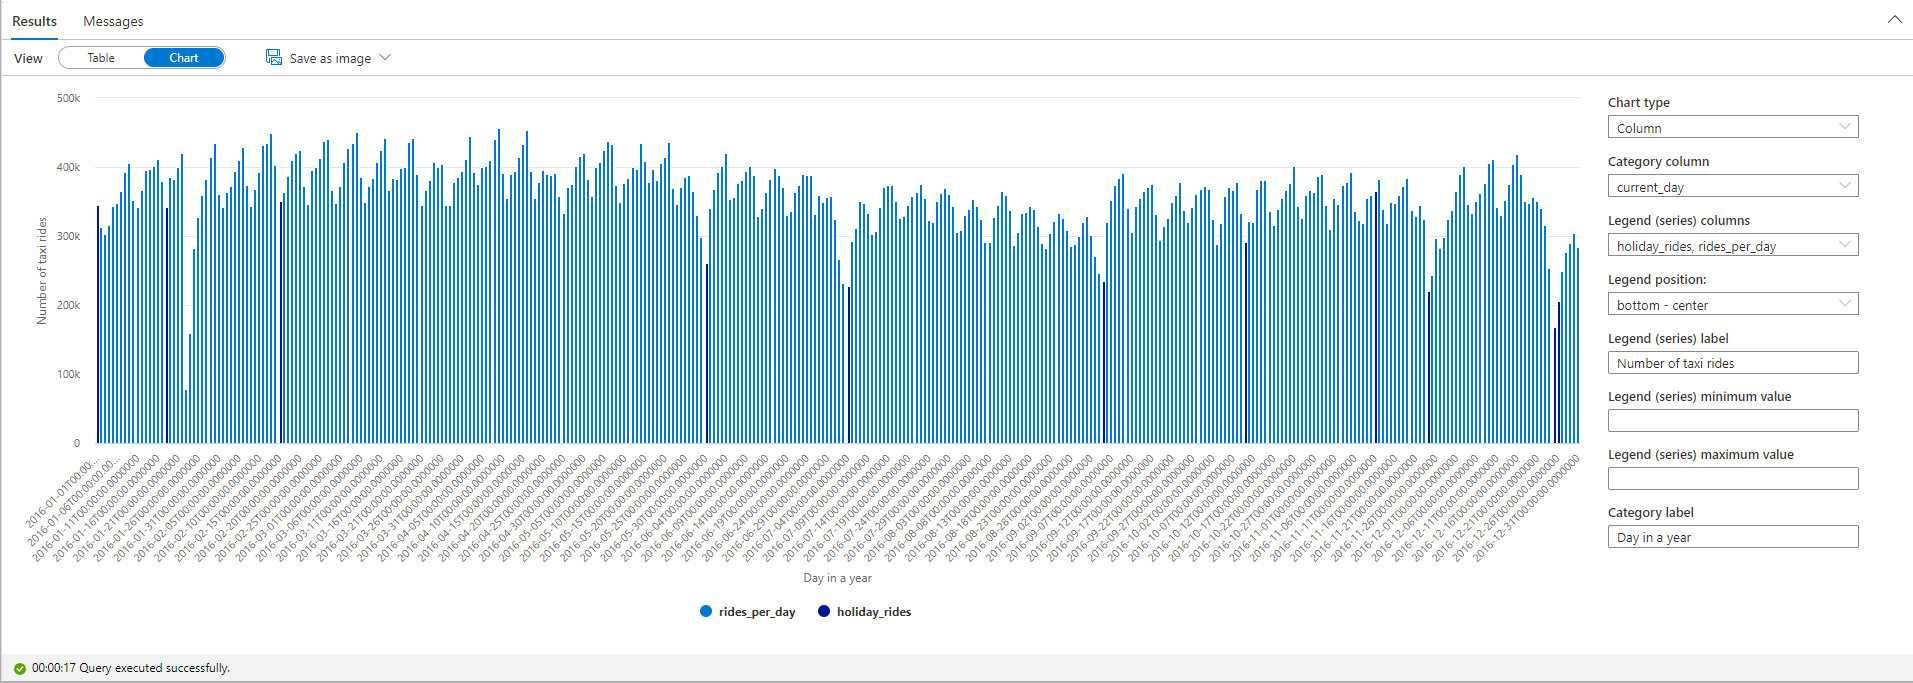
Again, you can visualize data by plotting the Column chart with the Category column set to current_day and the Legend (series) column set to rides_per_day.

From the plot chart, you can see there's a weekly pattern, with Saturdays as the peak day. During Summer months, there are fewer taxi rides because of vacations. Also, notice some significant drops in the number of taxi rides without a clear pattern of when and why they occur.
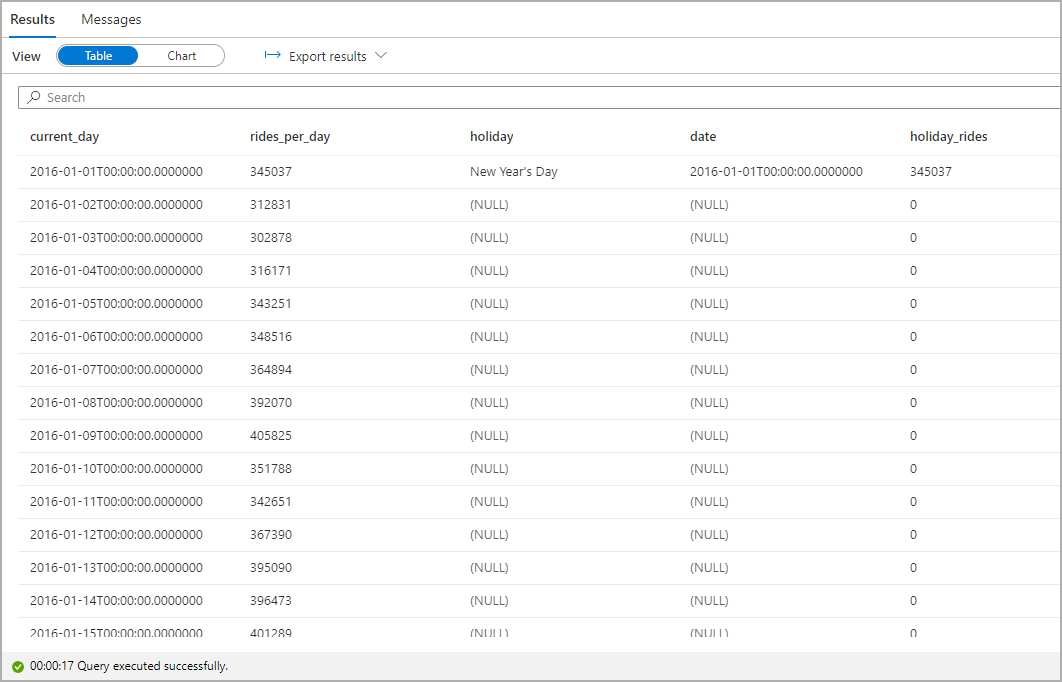
Next, see if the drop in rides correlates with public holidays. Check if there's a correlation by joining the NYC Taxi rides dataset with the Public Holidays dataset:
WITH taxi_rides AS (
SELECT
    CAST([tpepPickupDateTime] AS DATE) AS [current_day],
    COUNT(*) as rides_per_day
FROM
    OPENROWSET(
        BULK 'https://azureopendatastorage.blob.core.windows.net/nyctlc/yellow/puYear=*/puMonth=*/*.parquet',
        FORMAT='PARQUET'
    ) AS [nyc]
WHERE nyc.filepath(1) = '2016'
GROUP BY CAST([tpepPickupDateTime] AS DATE)
),
public_holidays AS (
SELECT
    holidayname as holiday,
    date
FROM
    OPENROWSET(
        BULK 'https://azureopendatastorage.blob.core.windows.net/holidaydatacontainer/Processed/*.parquet',
        FORMAT='PARQUET'
    ) AS [holidays]
WHERE countryorregion = 'United States' AND YEAR(date) = 2016
),
joined_data AS (
SELECT
    *
FROM taxi_rides t
LEFT OUTER JOIN public_holidays p on t.current_day = p.date
)

SELECT
    *,
    holiday_rides =
    CASE
      WHEN holiday is null THEN 0
      WHEN holiday is not null THEN rides_per_day
    END
FROM joined_data
ORDER BY current_day ASC

Highlight the number of taxi rides during public holidays. For that purpose, choose current_day for the Category column and rides_per_day and holiday_rides as the Legend (series) columns.

From the plot chart, you can see that during public holidays the number of taxi rides is lower. There's still one unexplained large drop on January 23. Let's check the weather in NYC on that day by querying the Weather Data dataset:
SELECT
    AVG(windspeed) AS avg_windspeed,
    MIN(windspeed) AS min_windspeed,
    MAX(windspeed) AS max_windspeed,
    AVG(temperature) AS avg_temperature,
    MIN(temperature) AS min_temperature,
    MAX(temperature) AS max_temperature,
    AVG(sealvlpressure) AS avg_sealvlpressure,
    MIN(sealvlpressure) AS min_sealvlpressure,
    MAX(sealvlpressure) AS max_sealvlpressure,
    AVG(precipdepth) AS avg_precipdepth,
    MIN(precipdepth) AS min_precipdepth,
    MAX(precipdepth) AS max_precipdepth,
    AVG(snowdepth) AS avg_snowdepth,
    MIN(snowdepth) AS min_snowdepth,
    MAX(snowdepth) AS max_snowdepth
FROM
    OPENROWSET(
        BULK 'https://azureopendatastorage.blob.core.windows.net/isdweatherdatacontainer/ISDWeather/year=*/month=*/*.parquet',
        FORMAT='PARQUET'
    ) AS [weather]
WHERE countryorregion = 'US' AND CAST([datetime] AS DATE) = '2016-01-23' AND stationname = 'JOHN F KENNEDY INTERNATIONAL AIRPORT'

The results of the query indicate that the drop in the number of taxi rides occurred because:
- There was a blizzard on that day in NYC with heavy snow (~30 cm).
- It was cold (temperature was below zero degrees Celsius).
- It was windy (~10 m/s).
This tutorial has shown how a data analyst can quickly perform exploratory data analysis. You can combine different datasets by using serverless SQL pool and visualize the results by using Azure Synapse Studio.
Related content
To learn how to connect serverless SQL pool to Power BI Desktop and create reports, see Connect serverless SQL pool to Power BI Desktop and create reports.
To learn how to use External tables in serverless SQL pool see Use external tables with Synapse SQL