Note
Access to this page requires authorization. You can try signing in or changing directories.
Access to this page requires authorization. You can try changing directories.
Note
The Time Series Insights service will be retired on 7 July 2024. Consider migrating existing environments to alternative solutions as soon as possible.
Caution
This is a Gen1 article.
This Azure Time Series Insights Explorer quickstart helps you get started with Azure Time Series Insights in a free demonstration environment. In this quickstart, you learn how to use your web browser to visualize large volumes of IoT data and tour key features that are generally available now.
Azure Time Series Insights is a fully managed analytics, storage, and visualization service that simplifies how to explore and analyze billions of IoT events simultaneously. It gives you a global view of your data so that you can quickly validate your IoT solution and avoid costly downtime to mission-critical devices. Azure Time Series Insights helps you to discover hidden trends, spot anomalies, and conduct root-cause analyses in near real time.
For additional flexibility, you can add Azure Time Series Insights to a preexisting application through its powerful REST APIs and client SDK. You can use the APIs to store, query, and consume time series data in a client application of your choice. You also can use the client SDK to add UI components to your existing application.
This Azure Time Series Insights Explorer quickstart offers a guided tour of features.
Important
Create a Azure account if you haven't created one already.
Prepare the demo environment
In your browser, go to the Gen1 demo.
If prompted, sign in to the Azure Time Series Insights Explorer by using your Azure account credentials.
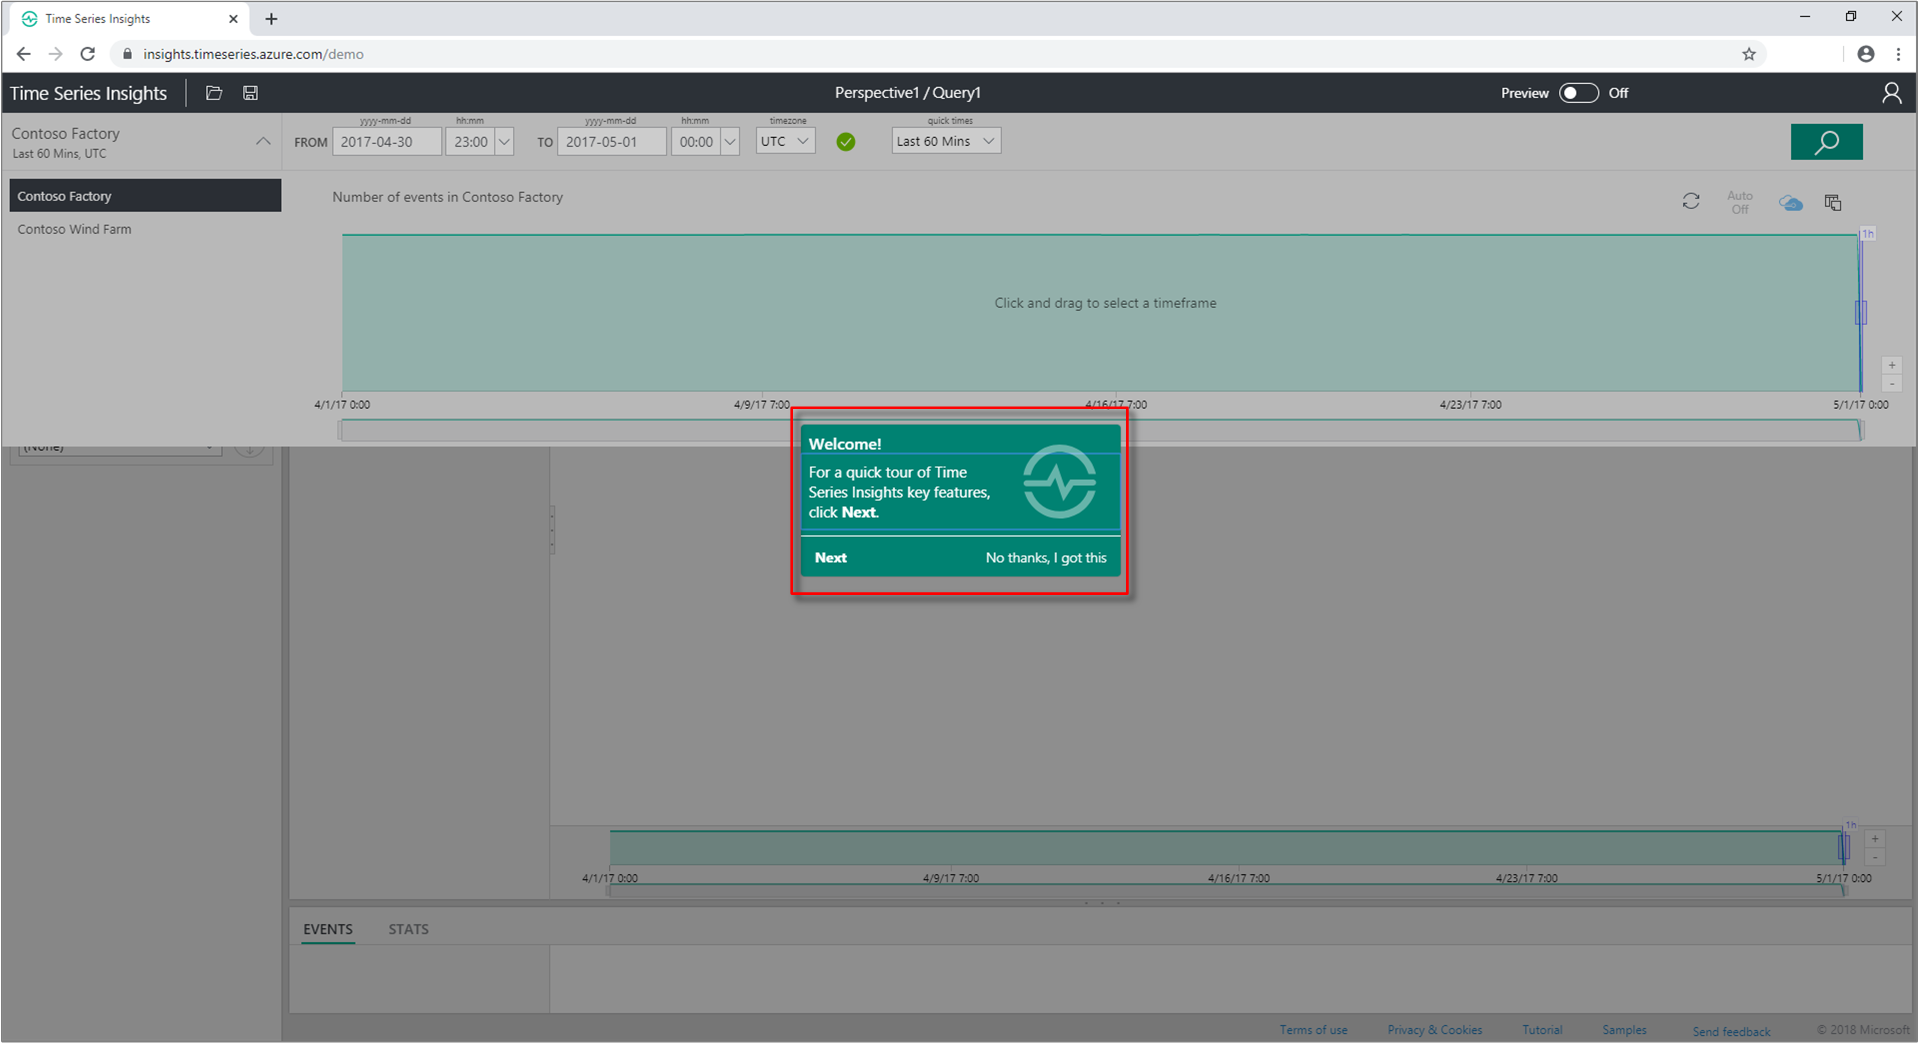
The Azure Time Series Insights quick tour page displays. Select Next to begin the quick tour.
Explore the demo environment
The Time selection panel displays. Use this panel to select a time frame to visualize.
Select a time frame and drag it in the region. Then select Search.
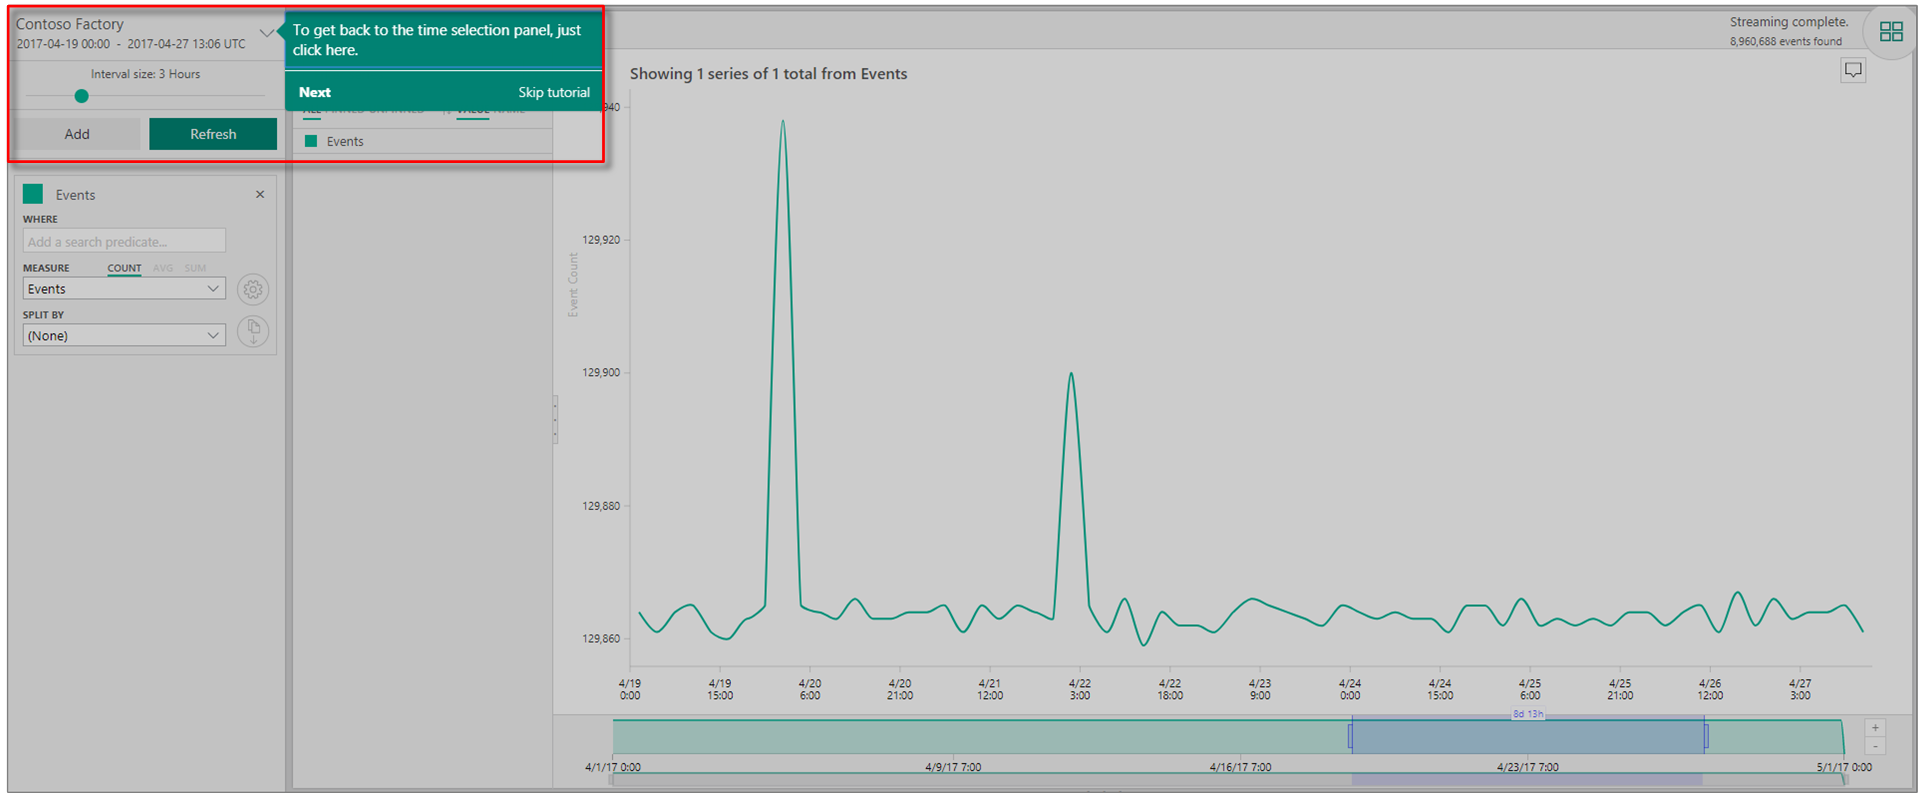
Azure Time Series Insights displays a chart visualization for the time frame you specified. You can do various actions within the line chart. For example, you can filter, pin, sort, and stack.
To return to the Time selection panel, select the down arrow as shown:
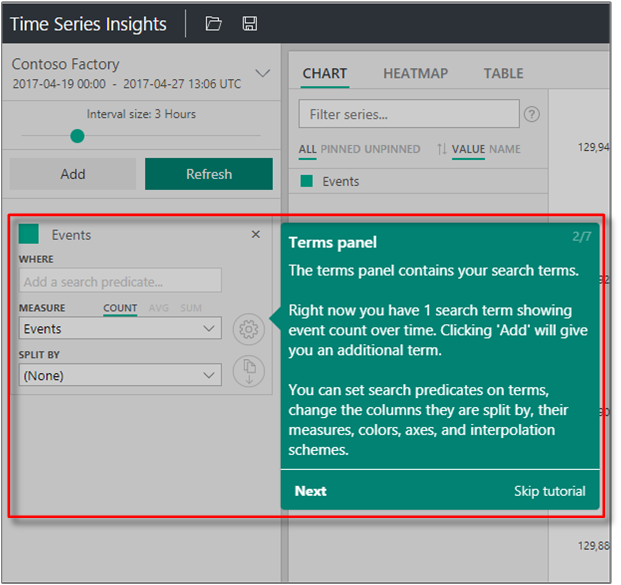
Select Add in the Terms panel to add a new search term.
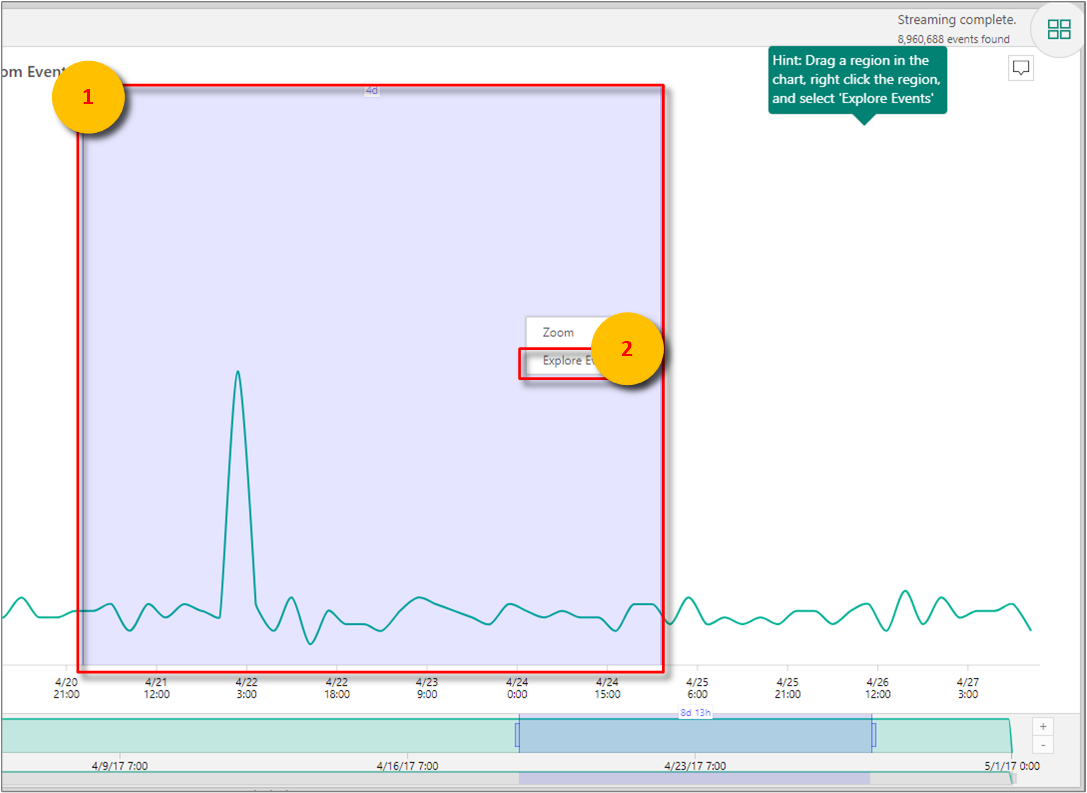
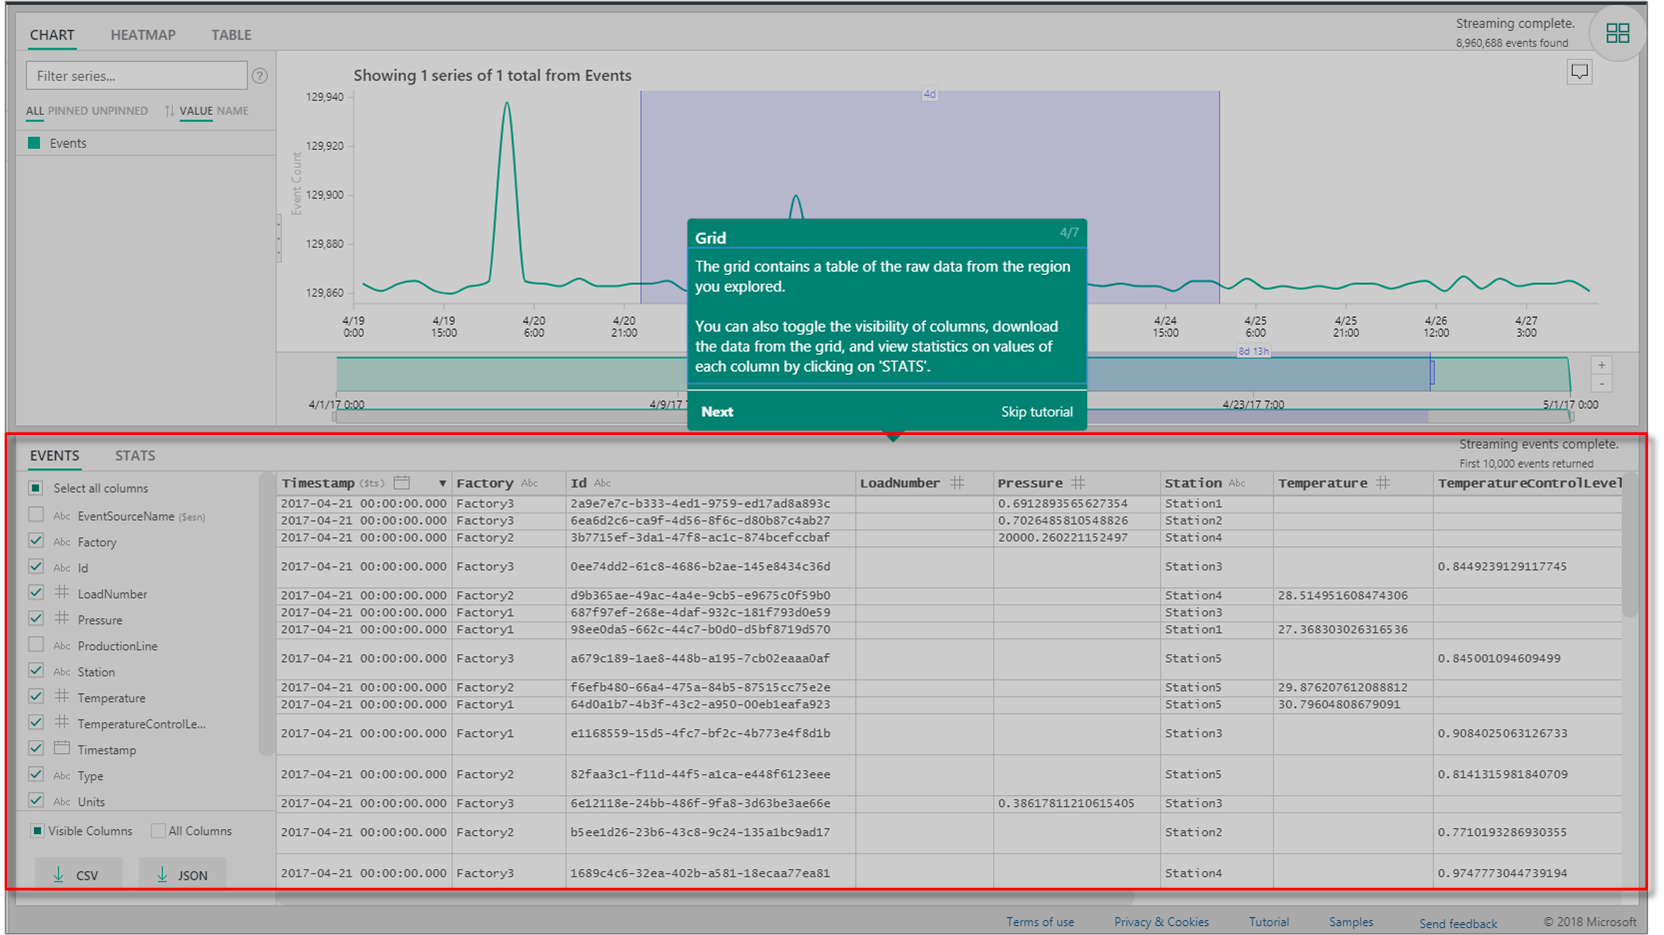
In the chart, you can select a region, right-click the region, and select Explore Events.
A grid of your raw data displays from the region that you're exploring.
Select and filter data
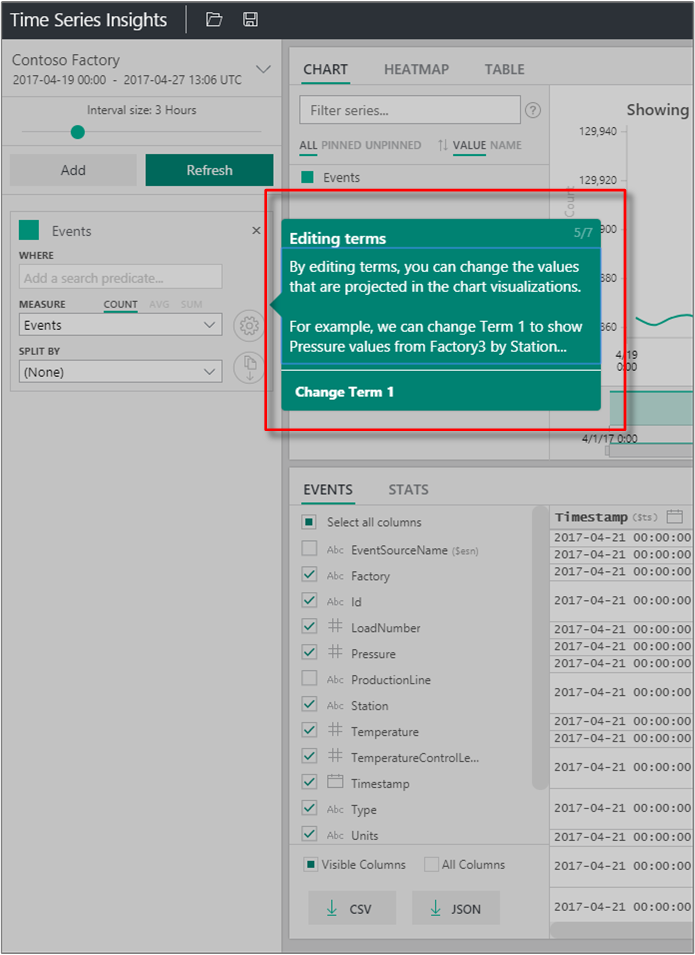
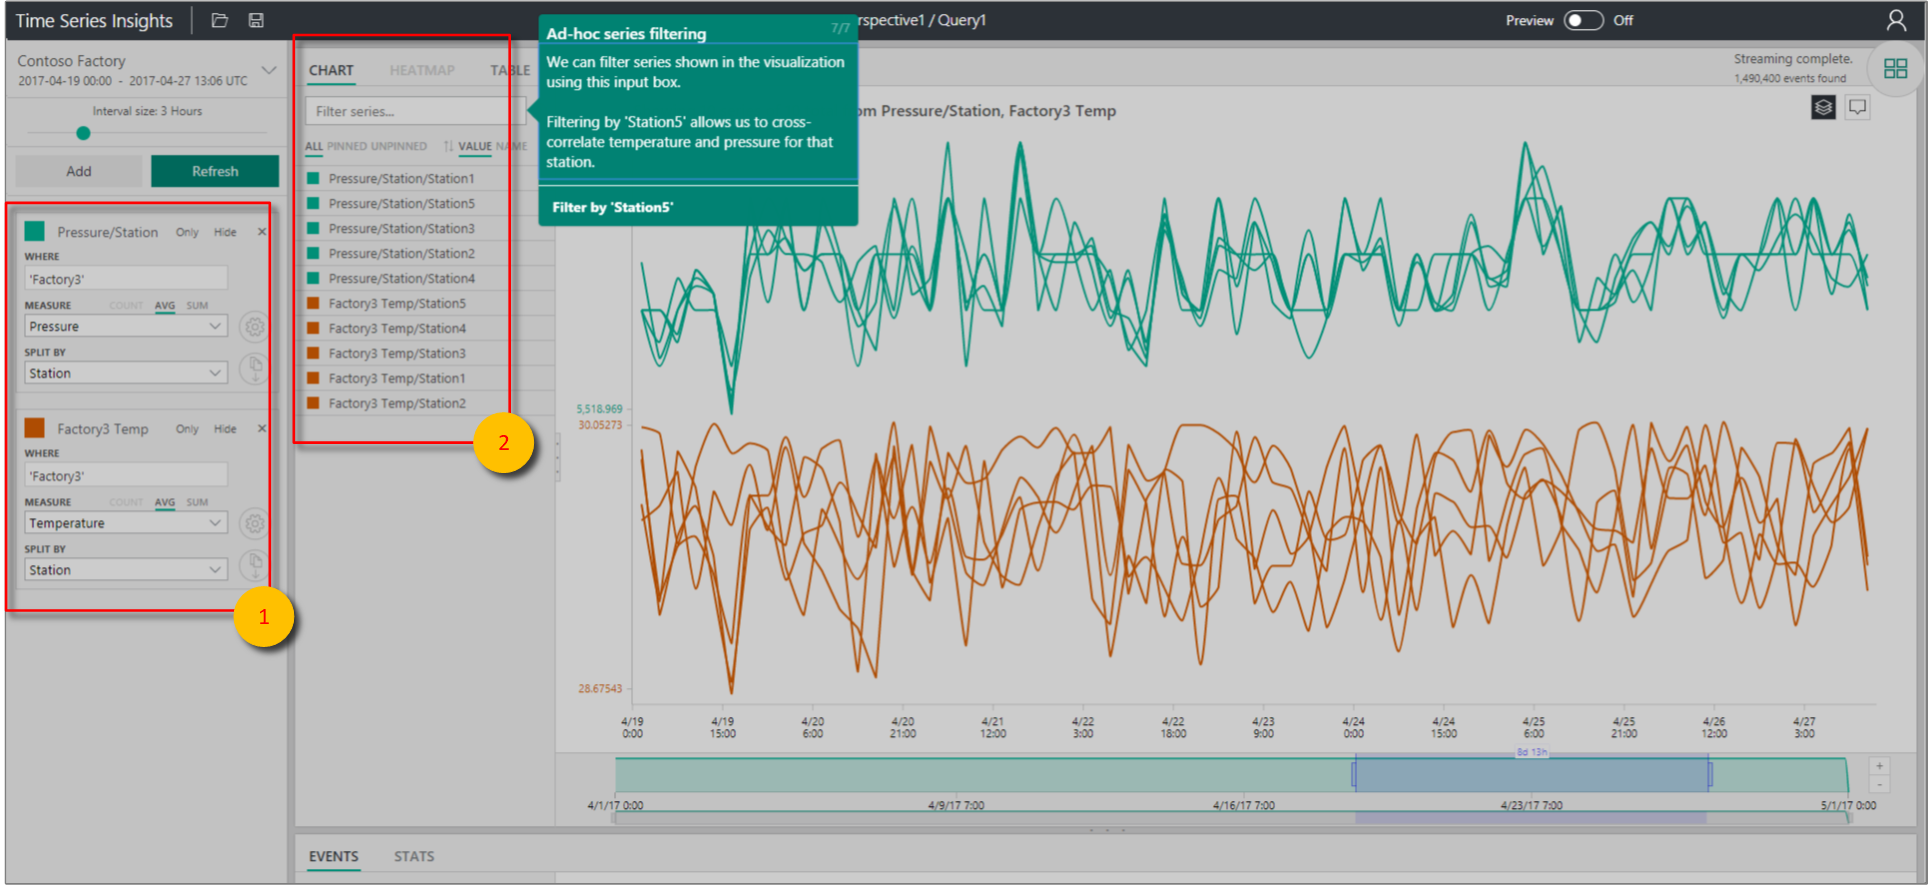
Edit your terms to change the values in the chart. Add another term to cross-correlate different types of values.
Leave the Filter series box blank to display all selected search terms or enter a filter term in the Filter series box for improvised series filtering.
For the quickstart, enter Station5 to cross-correlate temperature and pressure for that station.
After you finish the quickstart, you can experiment with the sample data set to create different visualizations.
Clean up resources
Now that you've completed the tutorial, clean up the resources you created:
- From the left menu in the Azure portal, select All resources, locate your Azure Time Series Insights resource group.
- Either delete the entire resource group (and all resources contained within it) by selecting Delete or remove each resource individually.
Next steps
- You're ready to create your own Azure Time Series Insights environment. Read Plan your Azure Time Series Insights environment.
