Spark SQL 可以使用基于成本的优化器 (CBO) 来改进查询计划。 这对于包含多个联接的查询特别有用。 要使此优化器有效,至关重要的是收集表和列的统计信息并使这些信息保持最新。
收集统计信息
若要充分利用 CBO,请务必同时收集列统计信息和表统计信息。 可以使用 ANALYZE TABLE 命令手动收集统计信息。
提示
若要使统计信息保持最新,请在将内容写入表后运行 ANALYZE TABLE。
验证查询计划
可通过多种方式来验证查询计划。
EXPLAIN 命令
若要检查计划是否使用统计信息,请使用 SQL 命令 EXPLAIN。
如果缺少统计信息,则查询计划可能不是最佳计划。
== Optimized Logical Plan ==
Aggregate [s_store_sk], [s_store_sk, count(1) AS count(1)L], Statistics(sizeInBytes=20.0 B, rowCount=1, hints=none)
+- Project [s_store_sk], Statistics(sizeInBytes=18.5 MB, rowCount=1.62E+6, hints=none)
   +- Join Inner, (d_date_sk = ss_sold_date_sk), Statistics(sizeInBytes=30.8 MB, rowCount=1.62E+6, hints=none)
      :- Project [ss_sold_date_sk, s_store_sk], Statistics(sizeInBytes=39.1 GB, rowCount=2.63E+9, hints=none)
      :  +- Join Inner, (s_store_sk = ss_store_sk), Statistics(sizeInBytes=48.9 GB, rowCount=2.63E+9, hints=none)
      :     :- Project [ss_store_sk, ss_sold_date_sk], Statistics(sizeInBytes=39.1 GB, rowCount=2.63E+9, hints=none)
      :     :  +- Filter (isnotnull(ss_store_sk) && isnotnull(ss_sold_date_sk)), Statistics(sizeInBytes=39.1 GB, rowCount=2.63E+9, hints=none)
      :     :     +- Relation[ss_store_sk,ss_sold_date_sk] parquet, Statistics(sizeInBytes=134.6 GB, rowCount=2.88E+9, hints=none)
      :     +- Project [s_store_sk], Statistics(sizeInBytes=11.7 KB, rowCount=1.00E+3, hints=none)
      :        +- Filter isnotnull(s_store_sk), Statistics(sizeInBytes=11.7 KB, rowCount=1.00E+3, hints=none)
      :           +- Relation[s_store_sk] parquet, Statistics(sizeInBytes=88.0 KB, rowCount=1.00E+3, hints=none)
      +- Project [d_date_sk], Statistics(sizeInBytes=12.0 B, rowCount=1, hints=none)
         +- Filter ((((isnotnull(d_year) && isnotnull(d_date)) && (d_year = 2000)) && (d_date = 2000-12-31)) && isnotnull(d_date_sk)), Statistics(sizeInBytes=38.0 B, rowCount=1, hints=none)
            +- Relation[d_date_sk,d_date,d_year] parquet, Statistics(sizeInBytes=1786.7 KB, rowCount=7.30E+4, hints=none)
重要
rowCount 统计信息对于具有多个联接的查询尤其重要。 如果缺少 rowCount,则意味着没有足够的信息来对其进行计算(也就是说,某些必需列没有统计信息)。
在 Databricks Runtime 16.0 及更高版本中,命令的 EXPLAIN 输出列出了缺少、部分和完整统计信息的引用表,如以下示例输出中所示:
== Optimizer Statistics (table names per statistics state) ==
  missing = date_dim, store
  partial =
  full    = store_sales
Corrective actions: consider running the following command on all tables with missing or partial statistics
  ANALYZE TABLE <table-name> COMPUTE STATISTICS FOR ALL COLUMNS
Spark SQL UI
使用 Spark SQL UI 页可以查看已执行的计划以及统计信息的准确性。

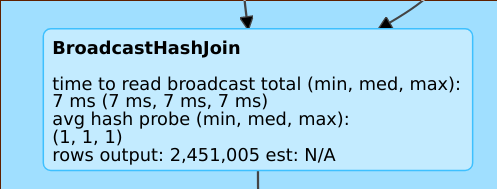
诸如 rows output: 2,451,005 est: N/A 之类的行表示此运算符大约生成 2 百万个行,但没有可用的统计信息。

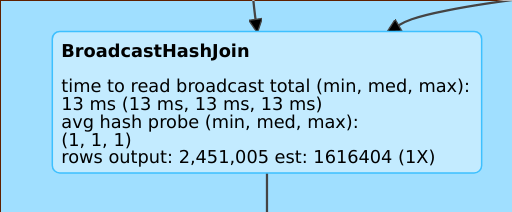
诸如 rows output: 2,451,005 est: 1616404 (1X) 之类的行表示此运算符大约生成 2 百万个行,而估算的行约为 160 万个,估算误差系数为 1。

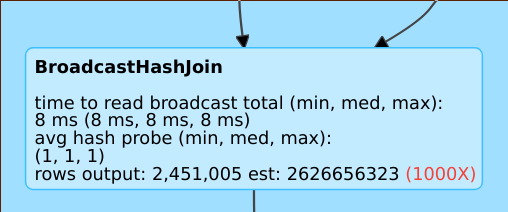
诸如 rows output: 2,451,005 est: 2626656323 之类的行表示此运算符大约生成 2 百万个行,而估算的行为 20 亿个,估算误差系数为 1000。
禁用基于成本的优化器
默认情况下,CBO 已启用。 可以通过更改 spark.sql.cbo.enabled 标志来禁用 CBO。
spark.conf.set("spark.sql.cbo.enabled", false)