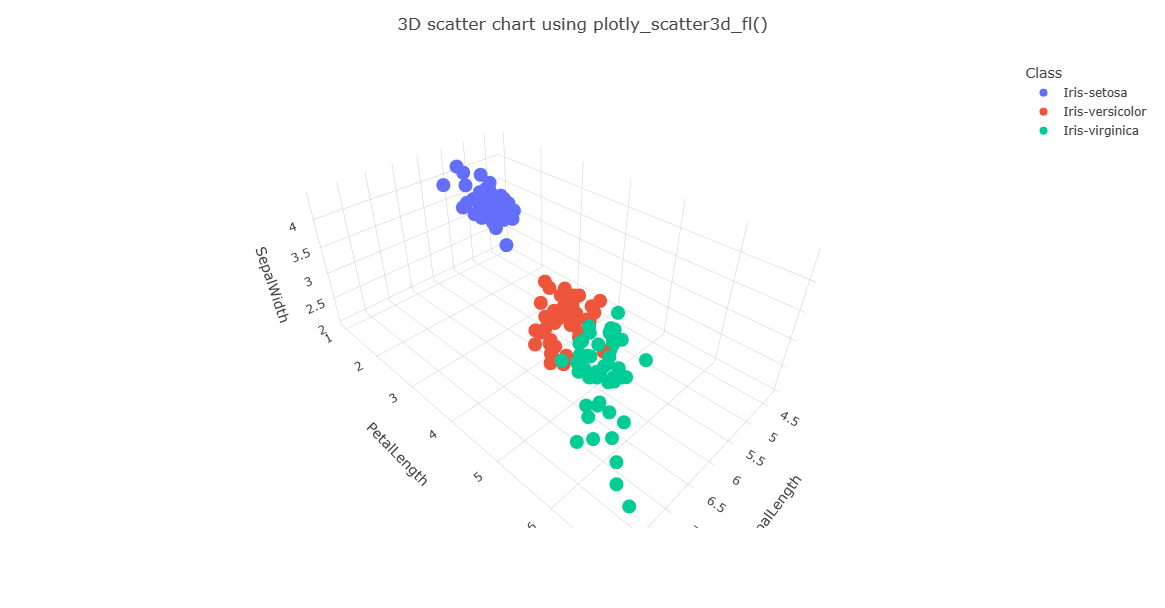
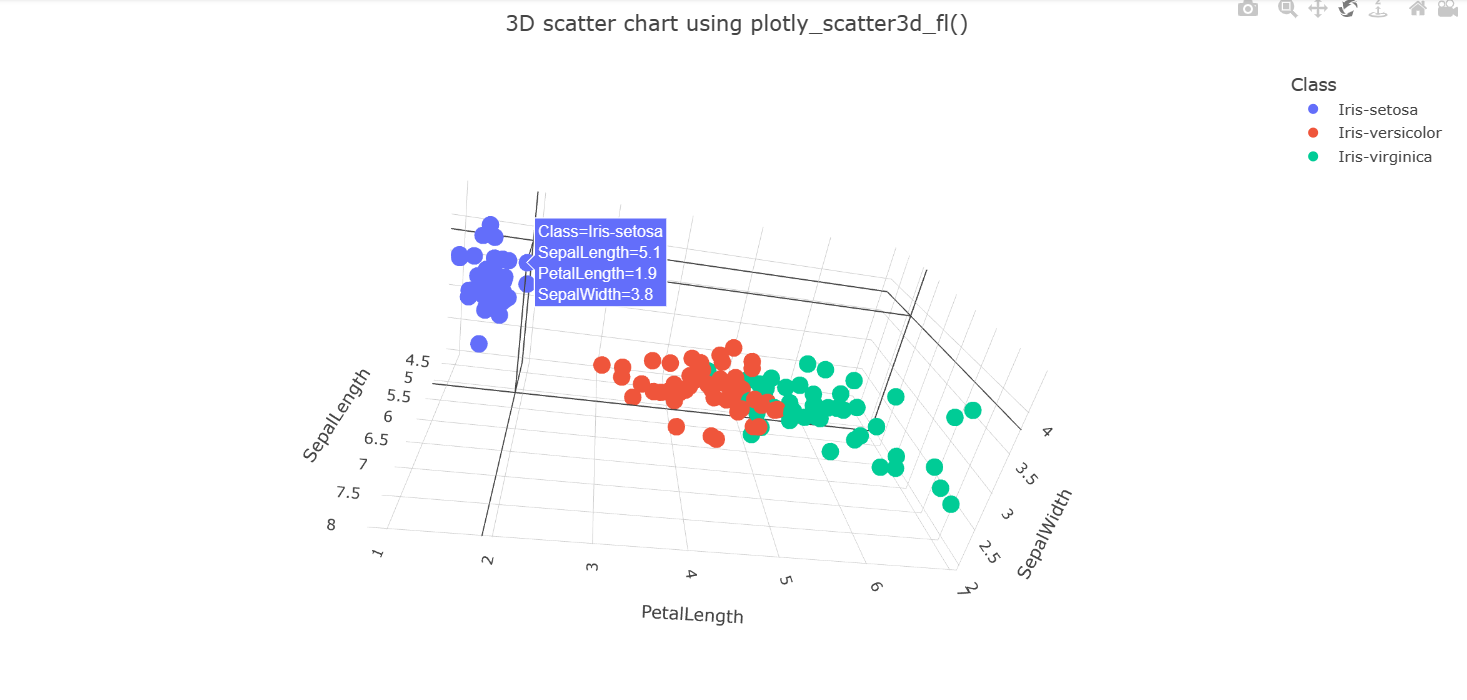
函数 plotly_scatter3d_fl() 是一个用户定义的函数 (UDF),可用来自定义 plotly 模板以创建交互式 3D 散点图。
该函数接受包含要呈现的记录、x/y/z 和聚合列名称以及图表标题字符串的表。 该函数返回只有一个单元格的表,其中包含 plotly JSON。 (可选)可以在 Azure 数据资源管理器仪表板图块中呈现数据。 有关详细信息,请参阅 Plotly(预览版)。
先决条件
从公用的 PlotlyTemplate 表中提取所需的“scatter3d”模板。 通过从目标数据库运行以下 KQL 命令,将此表从示例数据库复制到你的数据库:
.set PlotlyTemplate <| cluster('help.chinaeast2.kusto.chinacloudapi.cn').database('Samples').PlotlyTemplate
语法
T | invoke plotly_scatter3d_fl(x_col, y_col, z_col, aggr_col [, chart_title ])
详细了解语法约定。
参数
| 客户 | 类型 | 必需 | 说明 |
|---|---|---|---|
| x_col | string |
✔️ | 3D 绘图的 X 坐标列的名称。 |
| y_col | string |
✔️ | 3D 绘图的 Y 坐标列的名称。 |
| z_col | string |
✔️ | 3D 绘图的 Z 坐标列的名称。 |
| aggr_col | string |
✔️ | 分组列的名称。 同一组中的记录以不同的颜色呈现。 |
| chart_title | string |
图表标题。 默认值为“3D 散点图”。 |
函数定义
可以通过将函数的代码嵌入为查询定义的函数,或将其创建为数据库中的存储函数来定义函数,如下所示:
使用以下 let 语句定义函数。 不需要任何权限。
let plotly_scatter3d_fl=(tbl:(*), x_col:string, y_col:string, z_col:string, aggr_col:string='', chart_title:string='3D Scatter chart')
{
    let scatter3d_chart = toscalar(PlotlyTemplate | where name == "scatter3d" | project plotly);
    let tbl_ex = tbl | extend _x = column_ifexists(x_col, 0.0), _y = column_ifexists(y_col, 0.0), _z = column_ifexists(z_col, 0.0), _aggr = column_ifexists(aggr_col, 'ALL');
    tbl_ex
    | serialize
    | summarize _x=pack_array(make_list(_x)), _y=pack_array(make_list(_y)), _z=pack_array(make_list(_z)) by _aggr
    | summarize _aggr=make_list(_aggr), _x=make_list(_x), _y=make_list(_y), _z=make_list(_z)
    | extend plotly = scatter3d_chart
    | extend plotly=replace_string(plotly, '$CLASS1$', tostring(_aggr[0]))
    | extend plotly=replace_string(plotly, '$CLASS2$', tostring(_aggr[1]))
    | extend plotly=replace_string(plotly, '$CLASS3$', tostring(_aggr[2]))
    | extend plotly=replace_string(plotly, '$X_NAME$', x_col)
    | extend plotly=replace_string(plotly, '$Y_NAME$', y_col)
    | extend plotly=replace_string(plotly, '$Z_NAME$', z_col)
    | extend plotly=replace_string(plotly, '$CLASS1_X$', tostring(_x[0]))
    | extend plotly=replace_string(plotly, '$CLASS1_Y$', tostring(_y[0]))
    | extend plotly=replace_string(plotly, '$CLASS1_Z$', tostring(_z[0]))
    | extend plotly=replace_string(plotly, '$CLASS2_X$', tostring(_x[1]))
    | extend plotly=replace_string(plotly, '$CLASS2_Y$', tostring(_y[1]))
    | extend plotly=replace_string(plotly, '$CLASS2_Z$', tostring(_z[1]))
    | extend plotly=replace_string(plotly, '$CLASS3_X$', tostring(_x[2]))
    | extend plotly=replace_string(plotly, '$CLASS3_Y$', tostring(_y[2]))
    | extend plotly=replace_string(plotly, '$CLASS3_Z$', tostring(_z[2]))
    | extend plotly=replace_string(plotly, '$TITLE$', chart_title)
    | project plotly
};
// Write your query to use your function here.
示例
以下示例使用 invoke 运算符运行函数。
若要使用查询定义的函数,请在嵌入的函数定义后调用它。
let plotly_scatter3d_fl=(tbl:(*), x_col:string, y_col:string, z_col:string, aggr_col:string='', chart_title:string='3D Scatter chart')
{
    let scatter3d_chart = toscalar(PlotlyTemplate | where name == "scatter3d" | project plotly);
    let tbl_ex = tbl | extend _x = column_ifexists(x_col, 0.0), _y = column_ifexists(y_col, 0.0), _z = column_ifexists(z_col, 0.0), _aggr = column_ifexists(aggr_col, 'ALL');
    tbl_ex
    | serialize
    | summarize _x=pack_array(make_list(_x)), _y=pack_array(make_list(_y)), _z=pack_array(make_list(_z)) by _aggr
    | summarize _aggr=make_list(_aggr), _x=make_list(_x), _y=make_list(_y), _z=make_list(_z)
    | extend plotly = scatter3d_chart
    | extend plotly=replace_string(plotly, '$CLASS1$', tostring(_aggr[0]))
    | extend plotly=replace_string(plotly, '$CLASS2$', tostring(_aggr[1]))
    | extend plotly=replace_string(plotly, '$CLASS3$', tostring(_aggr[2]))
    | extend plotly=replace_string(plotly, '$X_NAME$', x_col)
    | extend plotly=replace_string(plotly, '$Y_NAME$', y_col)
    | extend plotly=replace_string(plotly, '$Z_NAME$', z_col)
    | extend plotly=replace_string(plotly, '$CLASS1_X$', tostring(_x[0]))
    | extend plotly=replace_string(plotly, '$CLASS1_Y$', tostring(_y[0]))
    | extend plotly=replace_string(plotly, '$CLASS1_Z$', tostring(_z[0]))
    | extend plotly=replace_string(plotly, '$CLASS2_X$', tostring(_x[1]))
    | extend plotly=replace_string(plotly, '$CLASS2_Y$', tostring(_y[1]))
    | extend plotly=replace_string(plotly, '$CLASS2_Z$', tostring(_z[1]))
    | extend plotly=replace_string(plotly, '$CLASS3_X$', tostring(_x[2]))
    | extend plotly=replace_string(plotly, '$CLASS3_Y$', tostring(_y[2]))
    | extend plotly=replace_string(plotly, '$CLASS3_Z$', tostring(_z[2]))
    | extend plotly=replace_string(plotly, '$TITLE$', chart_title)
    | project plotly
};
Iris
| invoke plotly_scatter3d_fl(x_col='SepalLength', y_col='PetalLength', z_col='SepalWidth', aggr_col='Class', chart_title='3D scatter chart using plotly_scatter3d_fl()')
| render plotly
输出
输出是一个 Plotly JSON 字符串,它可以在 Azure 数据资源管理器仪表板磁贴中呈现。 有关创建仪表板磁贴的详细信息,请参阅使用 Azure 数据资源管理器仪表板直观显示数据。

可以旋转、缩放和将鼠标悬停在特定的记录上:
