使用 “版本 ”下拉列表切换服务。 了解有关导航的详细信息。
适用于:✅ Azure Data Explorer ✅ Azure Monitor ✅ Microsoft Sentinel
图形语义支持两种用于处理图形的主要方法:为每个查询创建内存中的暂时性图形,以及定义为数据库中的图形模型和快照的持久图形。 本文提供了这两种方法的最佳做法,使你能够选择最佳方法并有效地使用 KQL 图形语义。
本指南涵盖:
- 图形创建和优化策略
- 查询技术和性能注意事项
- 持久图形的架构设计
- 与其他 KQL 功能的集成
- 要避免的常见陷阱
暂时性图形的最佳做法
使用make-graph运算符在内存中创建的暂时性图形非常适合临时分析、原型制作以及图形结构频繁变化或仅需要使用可用数据的子集的情境。
优化图形大小以提升性能
创建 make-graph 内存中表示形式,包括结构和属性。 通过以下方式优化性能:
- 提前应用筛选器 - 在创建图形之前仅选择相关的节点、边缘和属性
- 使用投影 - 删除不必要的列以最大程度地减少内存消耗
- 应用聚合 - 在适当情况下汇总数据以减少图形复杂性
示例:通过筛选和投影减小图形大小
在这种情况下,Bob 将经理从 Alice 更改为 Eve。 若要仅查看最新的组织状态,同时最大程度地减小图形大小:
let allEmployees = datatable(organization: string, name:string, age:long)
[
  "R&D", "Alice", 32,
  "R&D","Bob", 31,
  "R&D","Eve", 27,
  "R&D","Mallory", 29,
  "Marketing", "Alex", 35
];
let allReports = datatable(employee:string, manager:string, modificationDate: datetime)
[
  "Bob", "Alice", datetime(2022-05-23),
  "Bob", "Eve", datetime(2023-01-01),
  "Eve", "Mallory", datetime(2022-05-23),
  "Alice", "Dave", datetime(2022-05-23)
];
let filteredEmployees =
    allEmployees
    | where organization == "R&D"
    | project-away age, organization;
let filteredReports =
    allReports
    | summarize arg_max(modificationDate, *) by employee
    | project-away modificationDate;
filteredReports
| make-graph employee --> manager with filteredEmployees on name
| graph-match (employee)-[hasManager*2..5]-(manager)
  where employee.name == "Bob"
  project employee = employee.name, topManager = manager.name
输出:
| 员工 | 高级经理 |
|---|---|
| 鲍勃 | 马洛里 |
使用具体化视图维护当前状态
上一个示例演示了如何使用summarize和arg_max获取最后一个已知状态。 此操作可能占用大量计算资源,因此请考虑使用物化视图来提高性能。
步骤 1:使用版本控制创建表
使用图形时序的版本控制机制创建表:
.create table employees (organization: string, name:string, stateOfEmployment:string, properties:dynamic, modificationDate:datetime)

.create table reportsTo (employee:string, manager:string, modificationDate: datetime)
步骤 2:创建具体化视图
使用 arg_max聚合 函数确定最新状态:
.create materialized-view employees_MV on table employees
{
    employees
    | summarize arg_max(modificationDate, *) by name
}

.create materialized-view reportsTo_MV on table reportsTo
{
    reportsTo
    | summarize arg_max(modificationDate, *) by employee
}
步骤 3:创建帮助程序函数
确保仅使用实例化组件并应用其他筛选器:
.create function currentEmployees () {
    materialized_view('employees_MV')
    | where stateOfEmployment == "employed"
}

.create function reportsTo_lastKnownState () {
    materialized_view('reportsTo_MV')
    | project-away modificationDate
}
此方法为当前状态分析提供更快的查询、更高的并发性和较低的延迟,同时保留对历史数据的access。
let filteredEmployees =
    currentEmployees
    | where organization == "R&D"
    | project-away organization;
reportsTo_lastKnownState
| make-graph employee --> manager with filteredEmployees on name
| graph-match (employee)-[hasManager*2..5]-(manager)
  where employee.name == "Bob"
  project employee = employee.name, reportingPath = hasManager.manager
实现图形时间旅行
基于历史图状态分析数据可提供宝贵的时态上下文。 通过将时间筛选器与summarizearg_max结合来实现此“时间旅行”功能:
.create function graph_time_travel (interestingPointInTime:datetime ) {
    let filteredEmployees =
        employees
        | where modificationDate < interestingPointInTime
        | summarize arg_max(modificationDate, *) by name;
    let filteredReports =
        reportsTo
        | where modificationDate < interestingPointInTime
        | summarize arg_max(modificationDate, *) by employee
        | project-away modificationDate;
    filteredReports
    | make-graph employee --> manager with filteredEmployees on name
}
用法示例:
根据 2022年6月的图形状态,查询 Bob 的直属上级:
graph_time_travel(datetime(2022-06-01))
| graph-match (employee)-[hasManager*2..5]-(manager)
  where employee.name == "Bob"
  project employee = employee.name, reportingPath = hasManager.manager
输出:
| 员工 | 高级经理 |
|---|---|
| 鲍勃 | 戴夫 |
处理多个节点和边缘类型
使用包含多个节点类型的复杂图形时,请使用规范属性图模型。 使用属性 nodeId (字符串)、 label (字符串)和 properties (动态)定义节点,而边缘包括 source (字符串)、(字符串)、 destinationlabel (字符串)和 properties (动态)字段。
示例:工厂维护分析
考虑工厂经理调查设备问题和责任人员。 此方案将设备制造商的资产图与维护人员层次结构相结合:
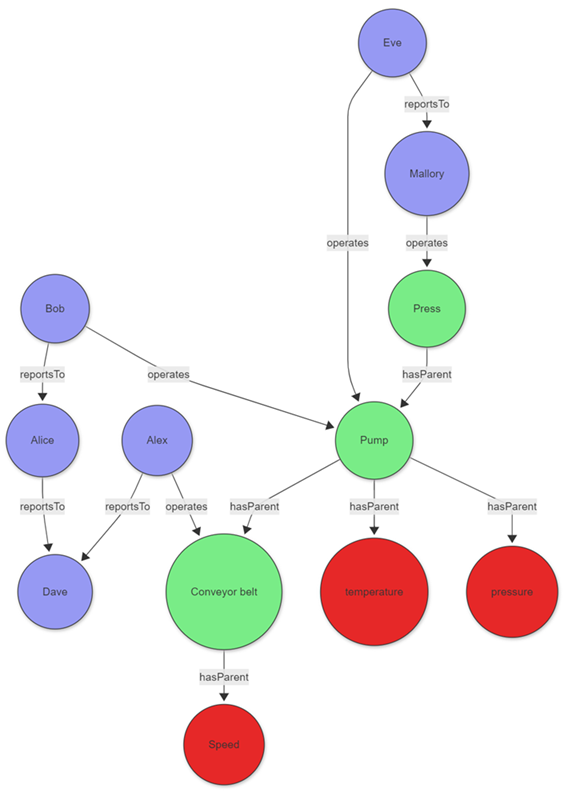
这些实体的数据可以直接存储在群集中,也可以使用查询联合获取到其他服务。 为了说明该示例,以下表格数据作为查询的一部分创建:
let sensors = datatable(sensorId:string, tagName:string, unitOfMeasure:string)
[
  "1", "temperature", "°C",
  "2", "pressure", "Pa",
  "3", "speed", "m/s"
];
let timeseriesData = datatable(sensorId:string, timestamp:string, value:double, anomaly: bool )
[
    "1", datetime(2023-01-23 10:00:00), 32, false,
    "1", datetime(2023-01-24 10:00:00), 400, true,
    "3", datetime(2023-01-24 09:00:00), 9, false
];
let employees = datatable(name:string, age:long)
[
  "Alice", 32,
  "Bob", 31,
  "Eve", 27,
  "Mallory", 29,
  "Alex", 35,
  "Dave", 45
];
let allReports = datatable(employee:string, manager:string)
[
  "Bob", "Alice",
  "Alice", "Dave",
  "Eve", "Mallory",
  "Alex", "Dave"
];
let operates = datatable(employee:string, machine:string, timestamp:datetime)
[
  "Bob", "Pump", datetime(2023-01-23),
  "Eve", "Pump", datetime(2023-01-24),
  "Mallory", "Press", datetime(2023-01-24),
  "Alex", "Conveyor belt", datetime(2023-01-24),
];
let assetHierarchy = datatable(source:string, destination:string)
[
  "1", "Pump",
  "2", "Pump",
  "Pump", "Press",
  "3", "Conveyor belt"
];
员工、传感器和其他实体和关系不共享规范数据模型。 联合运算符可用于合并和标准化数据。
以下查询将传感器数据与时序数据联接在一起,以识别具有异常读数的传感器,然后使用投影为图形节点创建通用模型。
let nodes =
    union
        (
            sensors
            | join kind=leftouter
            (
                timeseriesData
                | summarize hasAnomaly=max(anomaly) by sensorId
            ) on sensorId
            | project nodeId = sensorId, label = "tag", properties = pack_all(true)
        ),
        ( employees | project nodeId = name, label = "employee", properties = pack_all(true));
边缘以类似的方式转换。
let edges =
    union
        ( assetHierarchy | extend label = "hasParent" ),
        ( allReports | project source = employee, destination = manager, label = "reportsTo" ),
        ( operates | project source = employee, destination = machine, properties = pack_all(true), label = "operates" );
使用标准化节点和边缘数据,可以使用 make-graph 运算符创建图形
let graph = edges
| make-graph source --> destination with nodes on nodeId;
创建图形后,定义路径模式并project所需的信息。 模式从标记节点开始,然后通过可变长度的边缘连接到资源。 该资产由一名操作员通过一个名为reportsTo的可变长度边缘向顶级经理报告。 图形匹配运算符的约束部分(在本例中为 where 子句)将标记筛选为在特定日期出现异常的标记。
graph
| graph-match (tag)-[hasParent*1..5]->(asset)<-[operates]-(operator)-[reportsTo*1..5]->(topManager)
    where tag.label=="tag" and tobool(tag.properties.hasAnomaly) and
        startofday(todatetime(operates.properties.timestamp)) == datetime(2023-01-24)
        and topManager.label=="employee"
    project
        tagWithAnomaly = tostring(tag.properties.tagName),
        impactedAsset = asset.nodeId,
        operatorName = operator.nodeId,
        responsibleManager = tostring(topManager.nodeId)
输出
| 异常标签 | 受影响的资产 | operatorName | 责任经理 |
|---|---|---|---|
| 温度 | 泵 | 前夕 | 马洛里 |
graph-match投影显示温度传感器在指定日期表现出异常。 传感器由伊芙操作,她最终向马洛里汇报。 利用此信息,工厂经理可以联系 Eve,如有必要,Mallory 可以更好地了解异常情况。
持久图形的最佳做法
持久图(使用 图形模型和 图形快照定义)为高级图形分析需求提供可靠的解决方案。 这些图形在需要反复分析大型、复杂或不断发展的数据关系的情况下表现突出,并且通过使团队能够共享标准化的图形定义和一致的分析结果,从而促进协作。 通过在数据库中保留图形结构,此方法可显著提高定期查询的性能,并支持复杂的版本控制功能。
使用架构和定义实现一致性和性能
图形模型的明确架构至关重要,因为它指定节点和边缘类型及其属性。 此方法可确保数据一致性并实现高效的查询。 利用 Definition 部分来指定如何通过 AddNodes 和 AddEdges 步骤从表格数据中构建节点和边缘。
使用静态和动态标签进行灵活建模
对图形建模时,可以利用静态和动态标记方法实现最佳灵活性。 静态标签非常适合那些很少更改并且定义明确的节点和边缘类型。请在Schema部分定义这些类型,并在您的步骤的Labels数组中引用它们。 对于节点或边缘类型由数据值确定的情况(例如,当类型存储在列中时),请使用动态标签,方法是在步骤中指定 LabelsColumn 在运行时分配标签。 此方法对于具有异类或不断发展架构的图形特别有用。 这两种机制都可以有效地组合- 你可以为静态标签定义数组,并指定一个LabelsLabelsColumn用于合并数据中的标签,从而在对具有固定分类和数据驱动分类的复杂图形进行建模时提供最大的灵活性。
示例:对多个节点和边缘类型使用动态标签
以下示例演示表示专业关系的图形中动态标签的有效实现。 在此方案中,图形包含人员和公司作为节点,就业关系构成它们之间的边缘。 此模型的灵活性来自直接从源数据中的列确定节点和边缘类型,从而允许图形结构有机地适应基础信息。
.create-or-alter graph_model ProfessionalNetwork ```
{
  "Schema": {
    "Nodes": {
      "Person": {"Name": "string", "Age": "long"},
      "Company": {"Name": "string", "Industry": "string"}
    },
    "Edges": {
      "WORKS_AT": {"StartDate": "datetime", "Position": "string"}
    }
  },
  "Definition": {
    "Steps": [
      {
        "Kind": "AddNodes",
        "Query": "Employees | project Id, Name, Age, NodeType",
        "NodeIdColumn": "Id",
        "Labels": ["Person"],
        "LabelsColumn": "NodeType"
      },
      {
        "Kind": "AddEdges",
        "Query": "EmploymentRecords | project EmployeeId, CompanyId, StartDate, Position, RelationType",
        "SourceColumn": "EmployeeId",
        "TargetColumn": "CompanyId",
        "Labels": ["WORKS_AT"],
        "LabelsColumn": "RelationType"
      }
    ]
  }
}
```
这种动态标记方法在对具有大量节点和边缘类型的图形进行建模时提供了非凡的灵活性,无需在数据中出现新实体类型时修改架构。 通过将逻辑模型与物理实现分离,图形可以不断演变为表示新关系,而无需对基础架构进行结构更改。
大规模独立软件供应商(ISV)情境的多租户分区策略
在大型组织中,尤其是 ISV 方案,图形可以包含数十亿个节点和边缘。 此规模提出了独特的挑战,需要战略分区方法来保持性能,同时管理成本和复杂性。
了解挑战
大规模多租户环境通常具有以下特征:
- 数十亿个节点和边缘 - 超过传统图形数据库功能的企业级图形
- 租户大小分布 - 通常遵循幂律,其中 99.9% 的租户有中小型图,而 0.1% 的租户有大型图。
- 性能要求 - 需要实时分析(当前数据)和历史分析功能
- 成本注意事项 - 基础结构成本和分析功能之间的平衡
按自然边界进行分区
管理大规模图形的最有效方法是按自然边界(通常是租户标识符或组织单位)进行分区:
键分区策略:
- 基于租户的分区 - 按客户、组织或业务部门分隔图表
- 地理分区 - 按区域、国家/地区或数据中心位置进行划分
- 时态分区 - 按时间段分隔进行历史分析
- 功能分区 - 按业务域或应用程序区域拆分
示例:多租户组织结构
// Partition employees and reports by tenant
let tenantEmployees =
    allEmployees
    | where tenantId == "tenant_123"
    | project-away tenantId;

let tenantReports =
    allReports
    | where tenantId == "tenant_123"
    | summarize arg_max(modificationDate, *) by employee
    | project-away modificationDate, tenantId;

tenantReports
| make-graph employee --> manager with tenantEmployees on name
| graph-match (employee)-[hasManager*1..5]-(manager)
  where employee.name == "Bob"
  project employee = employee.name, reportingChain = hasManager.manager
混合方法:按租户大小区分临时性图与持久性图表
最经济高效的策略结合了基于租户特征的暂时性和持久性关系图:
中小型租户(99.9% 租户)
对大多数租户使用 暂时性图形 :
优点:
- 始终保持 up-to日期数据 - 无需维护快照
- 降低作业开销 - 无图模型或快照管理
- 经济高效 - 图结构无需额外的存储成本
- 即时可用性 - 无预处理延迟
实现模式:
.create function getTenantGraph(tenantId: string) {
    let tenantEmployees =
        employees
        | where tenant == tenantId and stateOfEmployment == "employed"
        | project-away tenant, stateOfEmployment;
    let tenantReports =
        reportsTo
        | where tenant == tenantId
        | summarize arg_max(modificationDate, *) by employee
        | project-away modificationDate, tenant;
    tenantReports
    | make-graph employee --> manager with tenantEmployees on name
}

// Usage for small tenant
getTenantGraph("small_tenant_456")
| graph-match (employee)-[reports*1..3]-(manager)
  where employee.name == "Alice"
  project employee = employee.name, managerChain = reports.manager
大型租户(占租户总数的0.1%)
对最大的租户使用 永久性图形 :
优点:
- 可伸缩性 - 处理超出内存限制的图形
- 性能优化 - 消除复杂查询的构造延迟
- 高级分析 - 支持复杂的图形算法和分析
- 历史分析 - 用于临时比较的多个快照
实现模式:
// Create graph model for large tenant (example: Contoso)
.create-or-alter graph_model ContosoOrgChart ```
{
    "Schema": {
        "Nodes": {
            "Employee": {
                "Name": "string",
                "Department": "string",
                "Level": "int",
                "JoinDate": "datetime"
            }
        },
        "Edges": {
            "ReportsTo": {
                "Since": "datetime",
                "Relationship": "string"
            }
        }
    },
    "Definition": {
        "Steps": [
            {
                "Kind": "AddNodes",
                "Query": "employees | where tenant == 'Contoso' and stateOfEmployment == 'employed' | project Name, Department, Level, JoinDate",
                "NodeIdColumn": "Name",
                "Labels": ["Employee"]
            },
            {
                "Kind": "AddEdges",
                "Query": "reportsTo | where tenant == 'Contoso' | summarize arg_max(modificationDate, *) by employee | project employee, manager, modificationDate as Since | extend Relationship = 'DirectReport'",
                "SourceColumn": "employee",
                "TargetColumn": "manager",
                "Labels": ["ReportsTo"]
            }
        ]
    }
}
```

// Create snapshot for Contoso
.create graph snapshot ContosoSnapshot from ContosoOrgChart

// Query Contoso's organizational graph
graph("ContosoOrgChart")
| graph-match (employee)-[reports*1..10]-(executive)
  where employee.Department == "Engineering"
  project employee = employee.Name, executive = executive.Name, pathLength = array_length(reports)
ISV 场景的最佳实践
- 从暂时性图形开始 - 使用暂时性图形开始所有新租户,以便于简单起见
- 监视增长模式 - 实现对需要持久图形的租户的自动检测
- 批处理快照创建 - 在低使用率期间计划快照更新
- 租户隔离 - 确保关系图模型和快照在租户之间正确隔离
- 资源管理 - 使用工作负荷组防止大型租户查询影响较小的租户
- 成本优化 - 根据实际使用模式定期查看和优化持久性/暂时性阈值
这种混合方法使组织能够为大多数租户提供始终最新的数据分析,同时为最大的租户提供企业级分析功能,从而优化整个客户群的成本和性能。