使用 “版本 ”下拉列表切换服务。 了解有关导航的详细信息。
适用于:✅ Azure Data Explorer ✅ Azure Monitor ✅ Microsoft Sentinel
make-graph 运算符根据边和节点的表格输入生成图形结构。
语法
边缘|make-graphSourceNodeId-->TargetNodeId [ withNodes1onNodeId1 [,Nodes2onNodeId2 ]]
边缘|make-graphSourceNodeId-->TargetNodeId [ with_node_id=NodeIdPropertyName ]
边缘|make-graphSourceNodeId-->TargetNodeId [ withNodes1onNodeId1 [,Nodes2onNodeId2 ]] partitioned-byPartitionColumn(GraphOperator)
参数
| 客户 | 类型 | 必需 | 说明 |
|---|---|---|---|
| Edges | string |
✔️ | 包含图形边的表格源,每一行表示图形中的边。 |
| SourceNodeId | string |
✔️ | Edges 中包含边的源节点 ID 的列。 |
| TargetNodeId | string |
✔️ | Edges 中包含边的目标节点 ID 的列。 |
| Nodes1,Nodes2 | string |
包含图形中节点属性的表格表达式。 | |
| NodesId1、NodesId2 | string |
Nodes1中具有节点 ID 的相应列,分别 Nodes2。 | |
| NodeIdPropertyName | string |
图形节点上节点 ID 的属性的名称。 | |
| PartitionColumn | string |
要按其对图形进行分区的列。 为此列中每个唯一值创建单独的图形。 | |
| GraphOperator | string |
要应用于每个分区图形的图形运算符。 |
返回
make-graph 运算符返回图形表达式,并且必须后跟图形运算符。 源 Edges 表达式中的每一行都会成为图形的一个边,其中包含作为行的列值的属性。
节点表格表达式中的每一行都会成为图形中的一个节点,其中包含作为行的列值的属性。 出现在 Edges 表中但在节点表中没有相应行的节点将被创建为具有相应节点 ID 和空属性的节点。
使用 partitioned-by 子句时,将为指定 PartitionColumn 中的每个唯一值创建单独的图形。 然后,指定的 GraphOperator 单独应用于每个分区的图形,结果合并为单个输出。 这对于多租户方案特别有用,即你想要单独分析每个租户的数据,同时维护相同的图形结构和分析逻辑。
重要
使用 partitioned-by 子句时, Edges 表和所有 Nodes 表都必须包含分区列。
注意
每个节点都有唯一标识符。 如果 Nodes1 和 Nodes2 表中都显示相同的节点 ID,则通过合并其属性来创建单个节点。 如果同一节点的属性值存在冲突,则任意选择其中一个值。
用户可以通过以下方式处理节点信息:
-
不需要节点信息:
make-graph使用源和目标完成。 -
显式节点属性:最多使用两个表格表达式,使用“
withNodes1onNodeId1 [,Nodes2onNodeId2 ]”。 -
默认节点标识符:使用“
with_node_id=DefaultNodeId”。
示例
边缘和节点图形
以下示例从边和节点表生成图形。 节点表示人员和系统,边表示节点之间的不同关系。
make-graph 运算符生成图形。 然后,graph-match 运算符与图形模式一起使用,以搜索导致 "Trent" 系统节点的攻击路径。
let nodes = datatable(name:string, type:string, age:int)
[
  "Alice", "Person", 23,
  "Bob", "Person", 31,
  "Eve", "Person", 17,
  "Mallory", "Person", 29,
  "Trent", "System", 99
];
let edges = datatable(Source:string, Destination:string, edge_type:string)
[
  "Alice", "Bob", "communicatesWith",
  "Alice", "Trent", "trusts",
  "Bob", "Trent", "hasPermission",
  "Eve", "Alice", "attacks",
  "Mallory", "Alice", "attacks",
  "Mallory", "Bob", "attacks"
];
edges
| make-graph Source --> Destination with nodes on name
| graph-match (mallory)-[attacks]->(compromised)-[hasPermission]->(trent)
  where mallory.name == "Mallory" and trent.name == "Trent" and attacks.edge_type == "attacks" and hasPermission.edge_type == "hasPermission"
  project Attacker = mallory.name, Compromised = compromised.name, System = trent.name
输出
| 攻击者 | 已泄露 | 系统 |
|---|---|---|
| Mallory | Bob | Trent |
默认节点标识符
以下示例仅使用边生成图形,并将 name 属性用作默认节点标识符。 从边的表格表达式创建图形时,这种方法很有用,可以确保节点标识符对后续 graph-match 运算符的约束部分可用。
let edges = datatable(source:string, destination:string, edge_type:string)
[
  "Alice", "Bob", "communicatesWith",
  "Alice", "Trent", "trusts",
  "Bob", "Trent", "hasPermission",
  "Eve", "Alice", "attacks",
  "Mallory", "Alice", "attacks",
  "Mallory", "Bob", "attacks"
];
edges
| make-graph source --> destination with_node_id=name
| graph-match (mallory)-[attacks]->(compromised)-[hasPermission]->(trent)
  where mallory.name == "Mallory" and trent.name == "Trent" and attacks.edge_type == "attacks" and hasPermission.edge_type == "hasPermission"
  project Attacker = mallory.name, Compromised = compromised.name, System = trent.name
输出
| 攻击者 | 已泄露 | 系统 |
|---|---|---|
| Mallory | Bob | Trent |
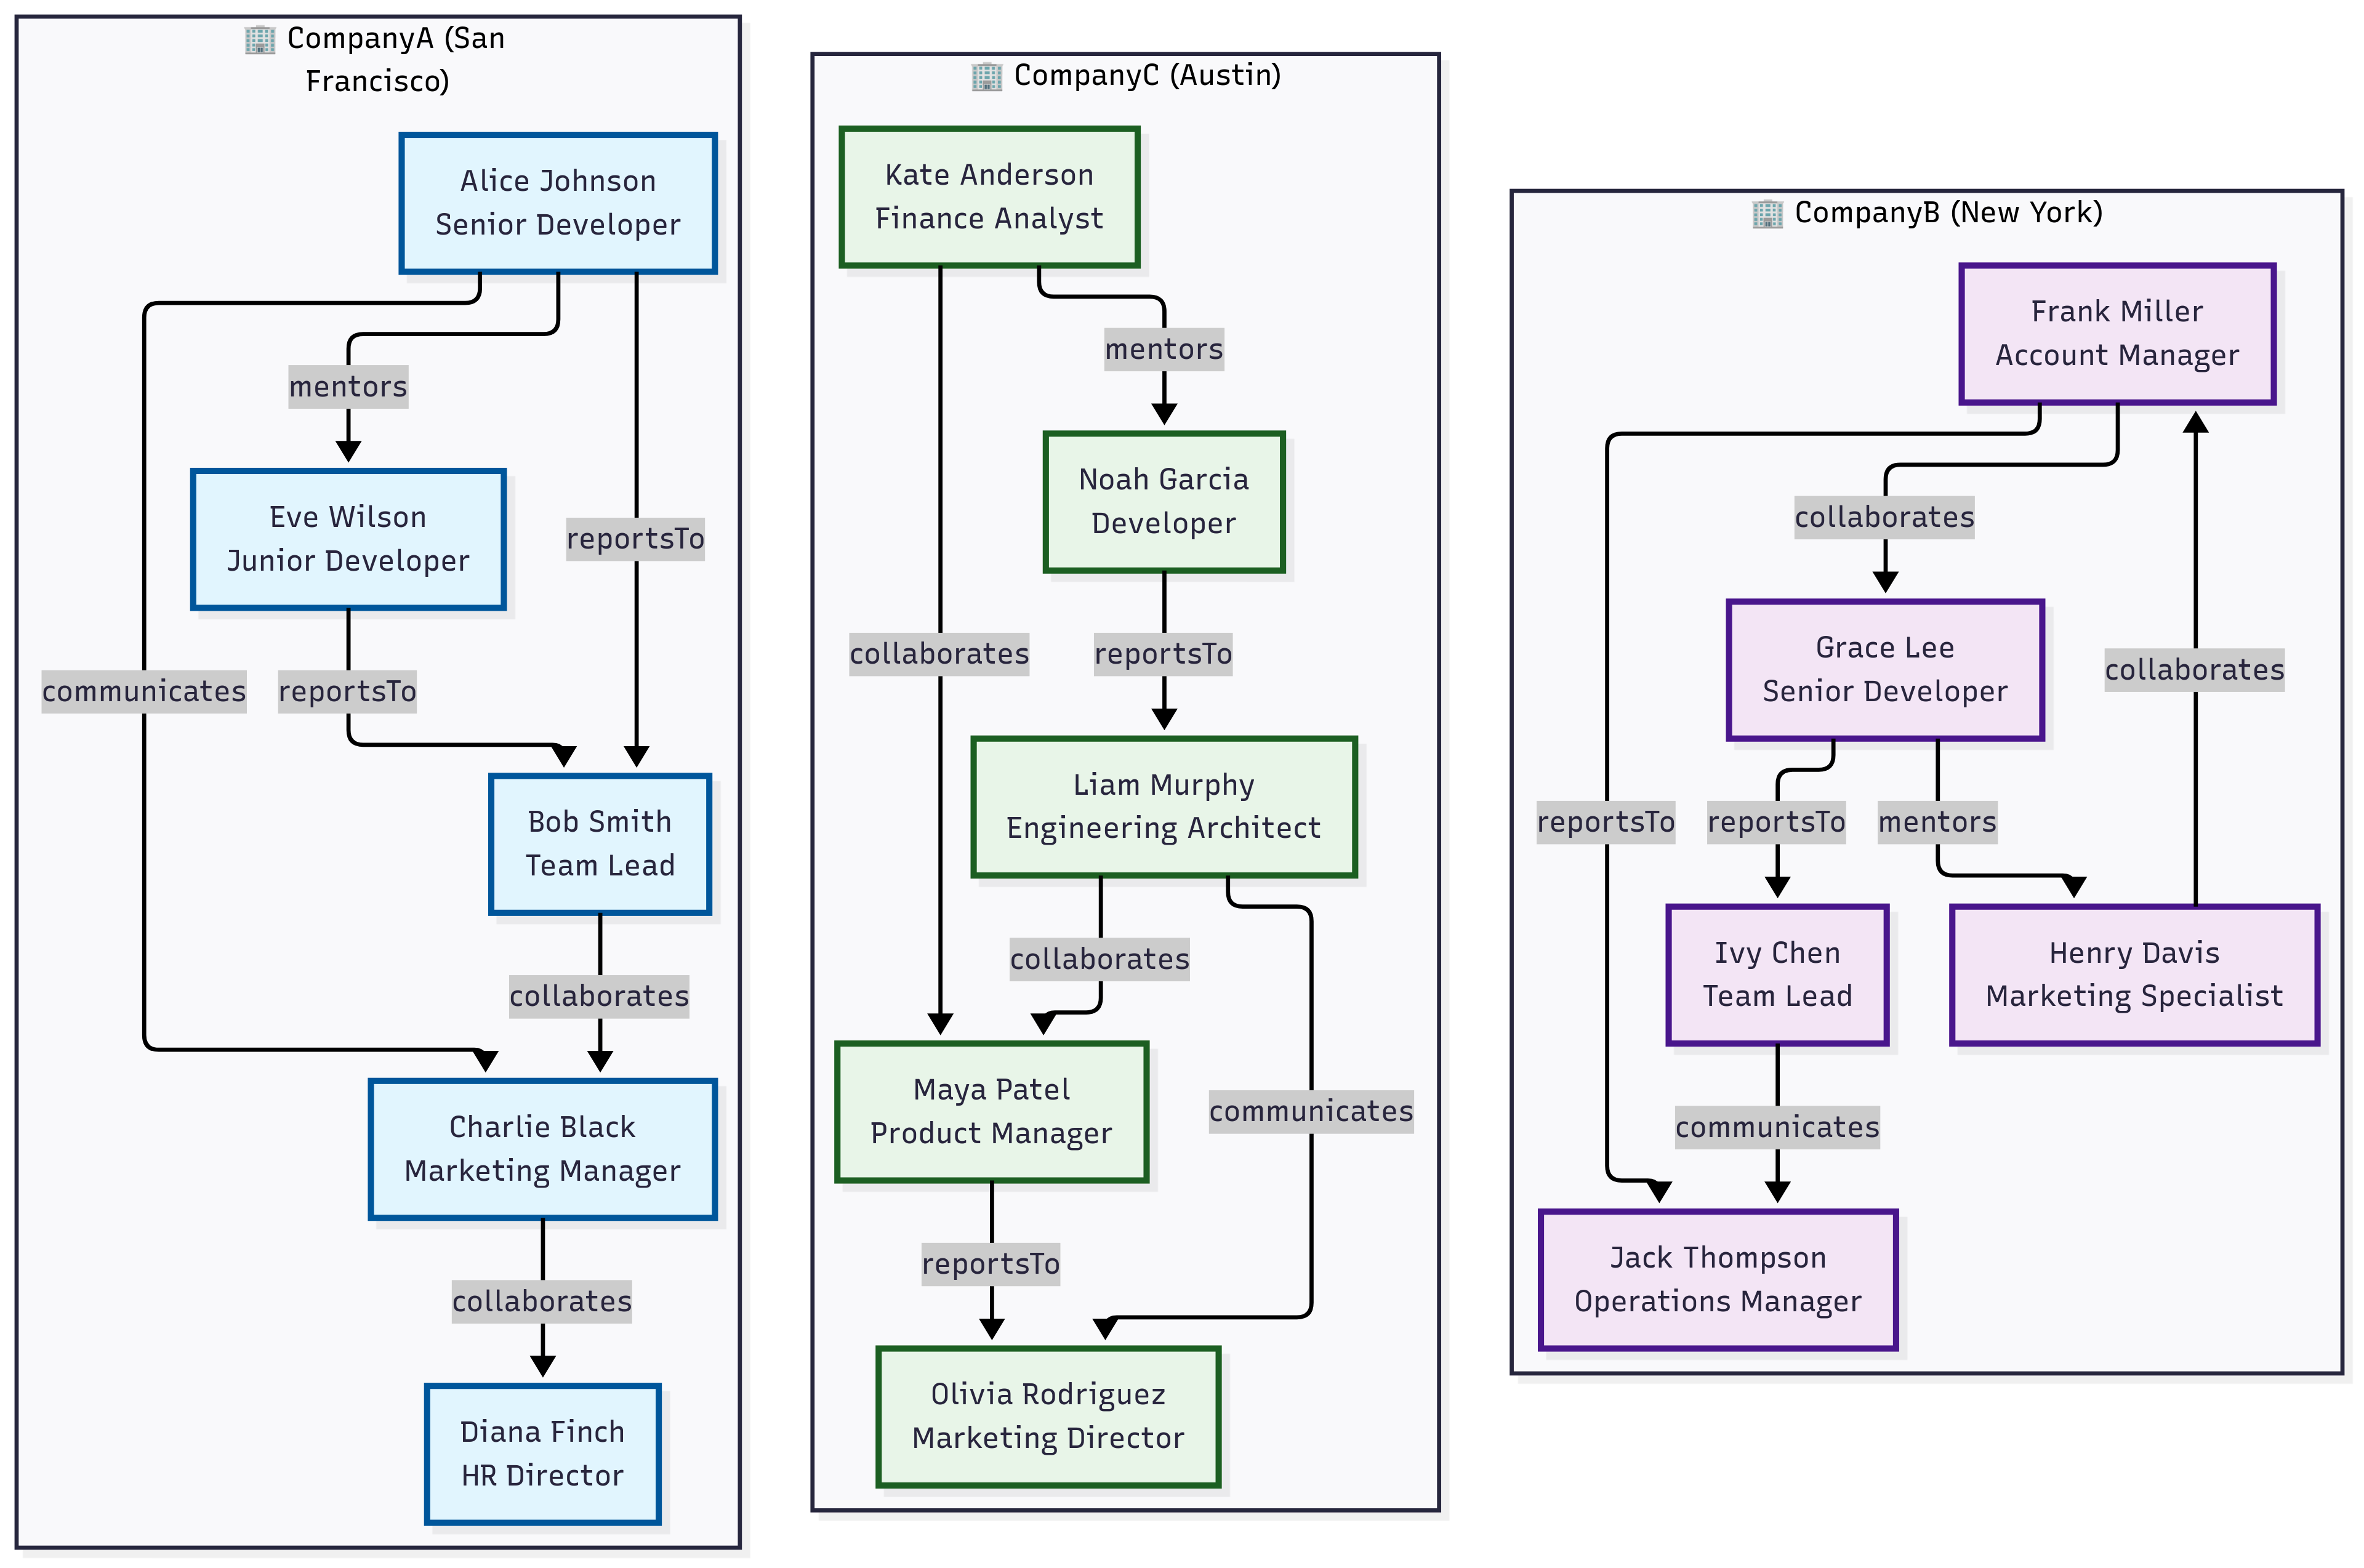
分区图
此示例演示如何使用 partitioned-by 子句分析多租户社交网络。 该 partitioned-by 子句为分区列中的每个唯一值创建单独的图形(在本例中), tenantId将图形运算符单独应用于每个分区,并合并结果。
// Nodes table representing users across multiple tenants (organizations)
let nodes = datatable(userId:string, tenantId:string, name:string, department:string, role:string, location:dynamic)
[
    // Tenant: CompanyA - San Francisco Bay Area
    "u001", "CompanyA", "Alice Johnson", "Engineering", "Senior Developer", dynamic({"type": "Point", "coordinates": [-122.4194, 37.7749]}),
    "u002", "CompanyA", "Bob Smith", "Engineering", "Team Lead", dynamic({"type": "Point", "coordinates": [-122.4094, 37.7849]}),
    "u003", "CompanyA", "Charlie Black", "Marketing", "Manager", dynamic({"type": "Point", "coordinates": [-122.4294, 37.7649]}),
    "u004", "CompanyA", "Diana Finch", "HR", "Director", dynamic({"type": "Point", "coordinates": [-122.3994, 37.7949]}),
    "u005", "CompanyA", "Eve Wilson", "Engineering", "Junior Developer", dynamic({"type": "Point", "coordinates": [-122.4394, 37.7549]}),
    // Tenant: CompanyB - New York Area
    "u006", "CompanyB", "Frank Miller", "Sales", "Account Manager", dynamic({"type": "Point", "coordinates": [-74.0060, 40.7128]}),
    "u007", "CompanyB", "Grace Lee", "Engineering", "Senior Developer", dynamic({"type": "Point", "coordinates": [-74.0160, 40.7228]}),
    "u008", "CompanyB", "Henry Davis", "Marketing", "Specialist", dynamic({"type": "Point", "coordinates": [-73.9960, 40.7028]}),
    "u009", "CompanyB", "Ivy Chen", "Engineering", "Team Lead", dynamic({"type": "Point", "coordinates": [-74.0260, 40.7328]}),
    "u010", "CompanyB", "Jack Thompson", "Operations", "Manager", dynamic({"type": "Point", "coordinates": [-73.9860, 40.6928]}),
    // Tenant: CompanyC - Austin Area
    "u011", "CompanyC", "Kate Anderson", "Finance", "Analyst", dynamic({"type": "Point", "coordinates": [-97.7431, 30.2672]}),
    "u012", "CompanyC", "Liam Murphy", "Engineering", "Architect", dynamic({"type": "Point", "coordinates": [-97.7331, 30.2772]}),
    "u013", "CompanyC", "Maya Patel", "Product", "Manager", dynamic({"type": "Point", "coordinates": [-97.7531, 30.2572]}),
    "u014", "CompanyC", "Noah Garcia", "Engineering", "Developer", dynamic({"type": "Point", "coordinates": [-97.7631, 30.2472]}),
    "u015", "CompanyC", "Olivia Rodriguez", "Marketing", "Director", dynamic({"type": "Point", "coordinates": [-97.7231, 30.2872]})
];
// Edges table representing relationships/interactions between users
let edges = datatable(sourceUserId:string, targetUserId:string, tenantId:string, relationshipType:string, strength:int)
[
    // CompanyA relationships
    "u001", "u002", "CompanyA", "reportsTo", 9,
    "u005", "u002", "CompanyA", "reportsTo", 8,
    "u002", "u003", "CompanyA", "collaborates", 6,
    "u001", "u005", "CompanyA", "mentors", 7,
    "u003", "u004", "CompanyA", "collaborates", 5,
    "u001", "u003", "CompanyA", "communicates", 4,
    // CompanyB relationships
    "u007", "u009", "CompanyB", "reportsTo", 9,
    "u006", "u010", "CompanyB", "reportsTo", 8,
    "u008", "u006", "CompanyB", "collaborates", 6,
    "u009", "u010", "CompanyB", "communicates", 5,
    "u007", "u008", "CompanyB", "mentors", 7,
    "u006", "u007", "CompanyB", "collaborates", 6,
    // CompanyC relationships
    "u014", "u012", "CompanyC", "reportsTo", 9,
    "u012", "u013", "CompanyC", "collaborates", 7,
    "u011", "u013", "CompanyC", "collaborates", 6,
    "u013", "u015", "CompanyC", "reportsTo", 8,
    "u012", "u015", "CompanyC", "communicates", 5,
    "u011", "u014", "CompanyC", "mentors", 6
];
edges
| make-graph sourceUserId --> targetUserId with nodes on userId partitioned-by tenantId (
    graph-match cycles=none (n1)-[e*2..4]->(n2)
        where n1.userId != n2.userId and all(e, relationshipType == "collaborates") and
            geo_distance_2points(todouble(n1.location.coordinates[0]), todouble(n1.location.coordinates[1]),
                             todouble(n2.location.coordinates[0]), todouble(n2.location.coordinates[1])) < 10000
        project Start = strcat(n1.name, " (", n1.tenantId, ")"), Tenants = map(e, tenantId), End = strcat(n2.name, " (", n2.tenantId, ")")
)
| Start | 租户 | 结束 |
|---|---|---|
| 鲍勃·史密斯(CompanyA) | [ “CompanyA”, “CompanyA” ] |
戴安娜·芬奇(公司) |
| 亨利·戴维斯(公司) | [ “CompanyB”, “CompanyB” ] |
格蕾丝·李(公司) |