适用于:✅Azure 数据资源管理器
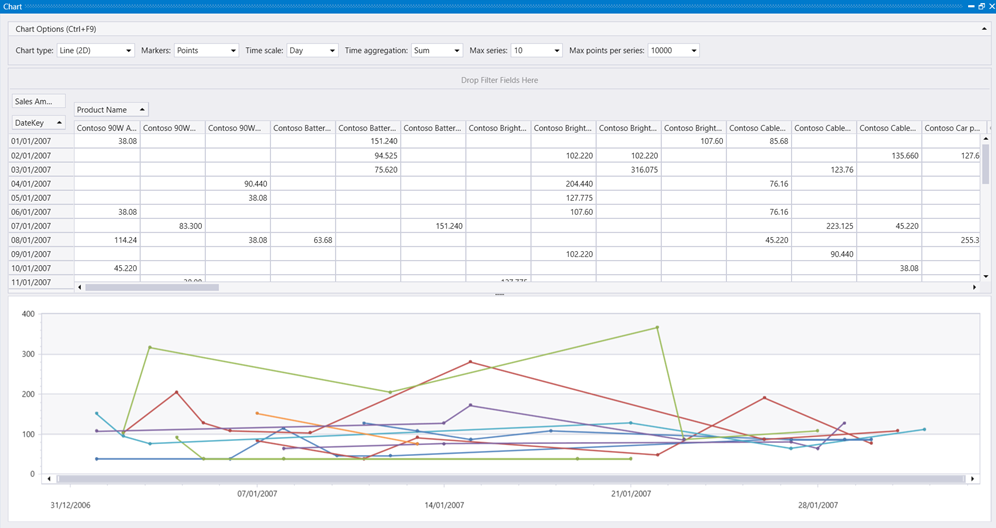
显示数据透视表和图表。 你可以通过交互方式选择数据、列、行和各种图表类型。
注意
- 此可视化效果只能在 render 运算符的上下文中使用。
- 此可视化效果可在 Kusto.Explorer 中使用,但在 Azure 数据资源管理器 Web UI 中不可用。
语法
T|renderpivotchart
详细了解语法约定。
参数
| 客户 | 类型 | 必需 | 说明 |
|---|---|---|---|
| T | string |
✔️ | 输入表名称。 |
示例
此查询详细分析指定日期范围内 Contoso 计算机产品的销售额,将其可视化为数据透视图。
本文中的示例使用 帮助群集中的公开可用表,例如
StormEvents数据库中的 表。
SalesFact
| join kind= inner Products on ProductKey
| where ProductCategoryName has "Computers" and ProductName has "Contoso"
| where DateKey between (datetime(2006-12-31) .. datetime(2007-02-01))
| project SalesAmount, ProductName, DateKey
| render pivotchart
输出
