概述
本教程介绍如何使用 Synapse Prometheus 连接器将现有本地 Prometheus 服务器与 Azure Synapse 工作区集成,以便使用 Synapse Prometheus 连接器实现近实时 Apache Spark 应用程序指标。
本教程还介绍了 Azure Synapse REST 指标 API。 可以通过 REST API 提取 Apache Spark 应用程序指标数据,以生成自己的监视和诊断工具包或与监视系统集成。
将 Azure Synapse Prometheus 连接器用于本地 Prometheus 服务器
Azure Synapse Prometheus 连接器 是一个开源项目。 Synapse Prometheus 连接器使用基于文件的服务发现方法,使你能够:
- 通过 Microsoft Entra 服务主体向 Synapse 工作区进行身份验证。
- 获取工作区 Apache Spark 应用程序列表。
- 通过基于 Prometheus 文件的配置拉取 Apache Spark 应用程序指标。
1. 先决条件
需要在 Linux VM 上部署 Prometheus 服务器。
2. 创建服务主体
若要在本地 Prometheus 服务器中使用 Azure Synapse Prometheus 连接器,应按照以下步骤创建服务主体。
2.1 创建服务主体:
az ad sp create-for-rbac --name <service_principal_name> --role Contributor --scopes /subscriptions/<subscription_id>
结果应如下所示:
{
  "appId": "abcdef...",
  "displayName": "<service_principal_name>",
  "name": "http://<service_principal_name>",
  "password": "abc....",
  "tenant": "<tenant_id>"
}
记下 appId、密码和租户 ID。
2.2 向在上述步骤中创建的服务主体添加相应的权限。
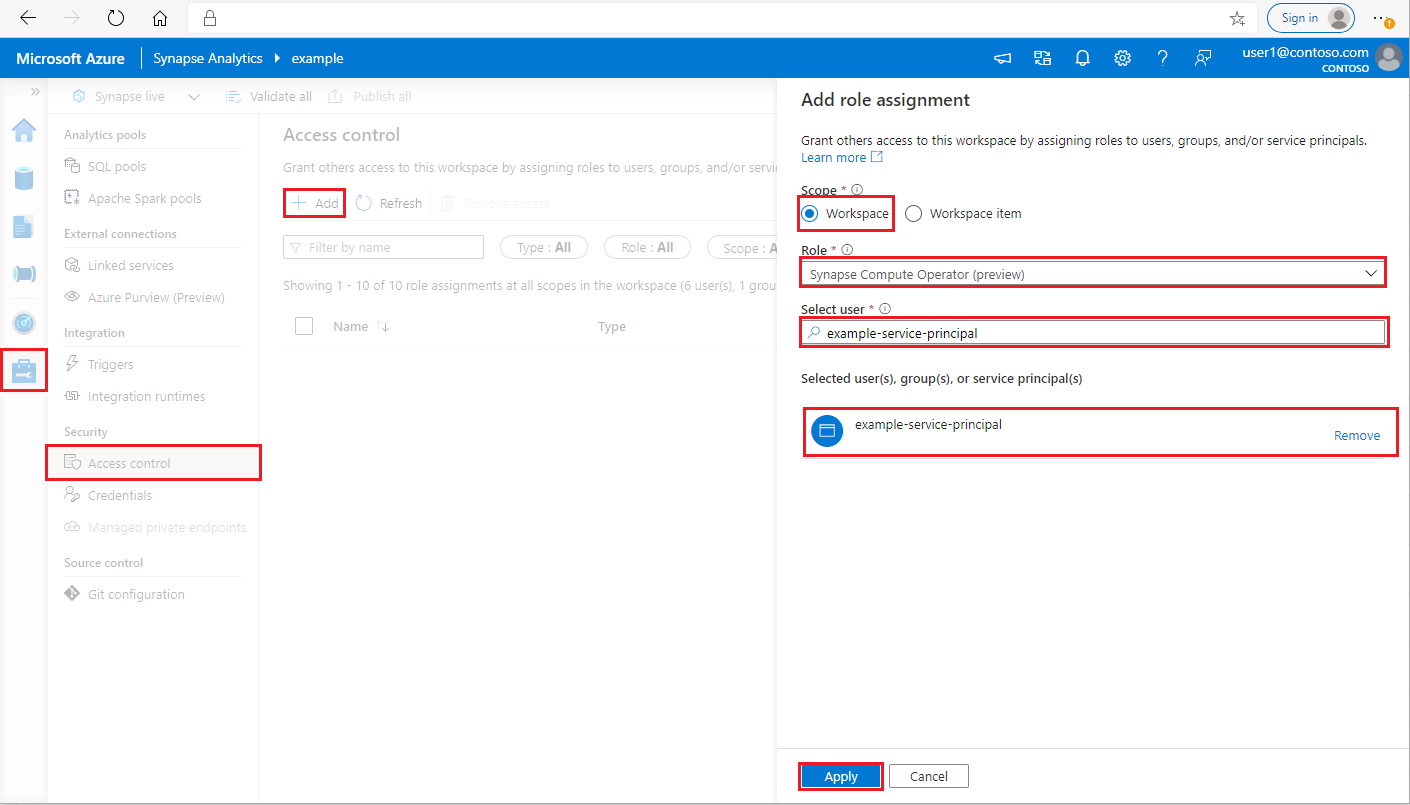
在 Synapse Studio 的左侧窗格中,选择“管理>访问控制”
单击左上角的“添加”按钮添加 角色分配
对于范围,请选择 “工作区”
对于“角色”,请选择“Synapse 计算操作员”
对于“选择用户”,请输入你的 <service_principal_name> 并单击你的服务主体
单击“应用”(请等待 3 分钟,让权限生效。)
3.下载 Azure Synapse Prometheus 连接器
使用命令安装 Azure Synapse Prometheus 连接器。
git clone https://github.com/microsoft/azure-synapse-spark-metrics.git
cd ./azure-synapse-spark-metrics/synapse-prometheus-connector/src
python pip install -r requirements.txt
4.为 Azure Synapse 工作区创建配置文件
在 config 文件夹中创建 config.yaml 文件,并填写以下字段:workspace_name、tenant_id、service_principal_name和service_principal_password。 可以在 yaml 配置中添加多个工作区。
workspaces:
  - workspace_name: <your_workspace_name>
    tenant_id: <tenant_id>
    service_principal_name: <service_principal_app_id>
    service_principal_password: "<service_principal_password>"
    synapse_host_suffix: "dev.azuresynapse.azure.cn"
    resource_uri: https://dev.azuresynapse.azure.cn
5. 更新 Prometheus 配置
在 Prometheus scrape_config 中添加以下 config 节,将 < your_workspace_name> 替换为你的工作区名称,并将 <path_to_synapse_connector> 替换为克隆的 synapse-prometheus-connector 文件夹
- job_name: synapse-prometheus-connector
  static_configs:
  - labels:
      __metrics_path__: /metrics
      __scheme__: http
    targets:
    - localhost:8000
- job_name: synapse-workspace-<your_workspace_name>
  bearer_token_file: <path_to_synapse_connector>/output/workspace/<your_workspace_name>/bearer_token
  file_sd_configs:
  - files:
    - <path_to_synapse_connector>/output/workspace/<your_workspace_name>/application_discovery.json
    refresh_interval: 10s
  metric_relabel_configs:
  - source_labels: [ __name__ ]
    target_label: __name__
    regex: metrics_application_[0-9]+_[0-9]+_(.+)
    replacement: spark_$1
  - source_labels: [ __name__ ]
    target_label: __name__
    regex: metrics_(.+)
    replacement: spark_$1
6.在 Prometheus 服务器 VM 中启动连接器
在 Prometheus 服务器 VM 中启动连接器服务器,如下所示。
python main.py
等待几秒钟,连接器应开始工作。 可以在 Prometheus 服务发现页中看到“synapse-prometheus-connector”。
使用 Azure Synapse Prometheus 或 REST 指标 API 收集指标数据
1.身份验证
可以使用客户端凭据流获取访问令牌。 若要访问指标 API,你应该为服务主体获取 Microsoft Entra 访问令牌,该令牌具有访问 API 所需的适当权限。
| 参数 | 必选 | DESCRIPTION |
|---|---|---|
| 租户ID | 真 实 | 你的 Azure 服务主体(应用程序)租户 ID |
| 授权类型 (grant_type) | 真 实 | 指定请求的授权类型。 在客户端凭据授权流程中,该值必须是client_credentials。 |
| 客户编号 | 真 实 | 在 Azure 门户或 Azure CLI 中注册的应用程序(服务主体)ID。 |
| 客户端密钥 | 真 实 | 为应用程序生成的机密(服务主体) |
| 资源 | 真 实 | Synapse 资源 URI 应为“https://dev.azuresynapse.azure.cn” |
curl -X GET -H 'Content-Type: application/x-www-form-urlencoded' \
  -d 'grant_type=client_credentials&client_id=<service_principal_app_id>&resource=<azure_synapse_resource_id>&client_secret=<service_principal_secret>' \
  https://login.partner.microsoftonline.cn/<tenant_id>/oauth2/token
响应如下所示:
{
  "token_type": "Bearer",
  "expires_in": "599",
  "ext_expires_in": "599",
  "expires_on": "1575500666",
  "not_before": "1575499766",
  "resource": "2ff8...f879c1d",
  "access_token": "ABC0eXAiOiJKV1Q......un_f1mSgCHlA"
}
2.列出在 Azure Synapse 工作区中运行的应用程序
若要获取 Synapse 工作区的 Apache Spark 应用程序列表,可以按照本文档 监视 - 获取 Apache Spark 作业列表。
3.使用 Prometheus 或 REST API 收集 Apache Spark 应用程序指标
使用 Prometheus API 收集 Apache Spark 应用程序指标
通过 Prometheus API 获取指定 Apache Spark 应用程序的最新指标
GET https://{endpoint}/livyApi/versions/{livyApiVersion}/sparkpools/{sparkPoolName}/sessions/{sessionId}/applications/{sparkApplicationId}/metrics/executors/prometheus?format=html
| 参数 | 必选 | DESCRIPTION |
|---|---|---|
| 端点 | 真 实 | 工作区开发终结点,例如 https://myworkspace.dev.azuresynapse.azure.cn. |
| livyApiVersion | 真 实 | 请求的有效 API 版本。 Currently, it is 2019-11-01-preview |
| sparkPoolName | 真 实 | Spark 池的名称。 |
| sessionId | 真 实 | 会话的标识符。 |
| Spark应用程序ID | 真 实 | Spark 应用程序 ID |
示例请求:
GET https://myworkspace.dev.azuresynapse.azure.cn/livyApi/versions/2019-11-01-preview/sparkpools/mysparkpool/sessions/1/applications/application_1605509647837_0001/metrics/executors/prometheus?format=html
示例响应:
状态代码:200 响应如下所示:
metrics_executor_rddBlocks{application_id="application_1605509647837_0001", application_name="mynotebook_mysparkpool_1605509570802", executor_id="driver"} 0
metrics_executor_memoryUsed_bytes{application_id="application_1605509647837_0001", application_name="mynotebook_mysparkpool_1605509570802", executor_id="driver"} 74992
metrics_executor_diskUsed_bytes{application_id="application_1605509647837_0001", application_name="mynotebook_mysparkpool_1605509570802", executor_id="driver"} 0
metrics_executor_totalCores{application_id="application_1605509647837_0001", application_name="mynotebook_mysparkpool_1605509570802", executor_id="driver"} 0
metrics_executor_maxTasks{application_id="application_1605509647837_0001", application_name="mynotebook_mysparkpool_1605509570802", executor_id="driver"} 0
metrics_executor_activeTasks{application_id="application_1605509647837_0001", application_name="mynotebook_mysparkpool_1605509570802", executor_id="driver"} 1
metrics_executor_failedTasks_total{application_id="application_1605509647837_0001", application_name="mynotebook_mysparkpool_1605509570802", executor_id="driver"} 0
metrics_executor_completedTasks_total{application_id="application_1605509647837_0001", application_name="mynotebook_mysparkpool_1605509570802", executor_id="driver"} 2
...
使用 REST API 收集 Apache Spark 应用程序指标
GET https://{endpoint}/livyApi/versions/{livyApiVersion}/sparkpools/{sparkPoolName}/sessions/{sessionId}/applications/{sparkApplicationId}/executors
| 参数 | 必选 | DESCRIPTION |
|---|---|---|
| 端点 | 真 实 | 工作区开发终结点,例如 https://myworkspace.dev.azuresynapse.azure.cn. |
| livyApiVersion | 真 实 | 请求的有效 API 版本。 Currently, it is 2019-11-01-preview |
| sparkPoolName | 真 实 | Spark 池的名称。 |
| sessionId | 真 实 | 会话的标识符。 |
| sparkApplicationId | 真 实 | Spark 应用程序 ID |
示例请求
GET https://myworkspace.dev.azuresynapse.azure.cn/livyApi/versions/2019-11-01-preview/sparkpools/mysparkpool/sessions/1/applications/application_1605509647837_0001/executors
示例响应状态代码:200
[
    {
        "id": "driver",
        "hostPort": "f98b8fc2aea84e9095bf2616208eb672007bde57624:45889",
        "isActive": true,
        "rddBlocks": 0,
        "memoryUsed": 75014,
        "diskUsed": 0,
        "totalCores": 0,
        "maxTasks": 0,
        "activeTasks": 0,
        "failedTasks": 0,
        "completedTasks": 0,
        "totalTasks": 0,
        "totalDuration": 0,
        "totalGCTime": 0,
        "totalInputBytes": 0,
        "totalShuffleRead": 0,
        "totalShuffleWrite": 0,
        "isBlacklisted": false,
        "maxMemory": 15845975654,
        "addTime": "2020-11-16T06:55:06.718GMT",
        "executorLogs": {
            "stdout": "http://f98b8fc2aea84e9095bf2616208eb672007bde57624:8042/node/containerlogs/container_1605509647837_0001_01_000001/trusted-service-user/stdout?start=-4096",
            "stderr": "http://f98b8fc2aea84e9095bf2616208eb672007bde57624:8042/node/containerlogs/container_1605509647837_0001_01_000001/trusted-service-user/stderr?start=-4096"
        },
        "memoryMetrics": {
            "usedOnHeapStorageMemory": 75014,
            "usedOffHeapStorageMemory": 0,
            "totalOnHeapStorageMemory": 15845975654,
            "totalOffHeapStorageMemory": 0
        },
        "blacklistedInStages": []
    },
    // ...
]
4.构建自己的诊断和监视工具
Prometheus API 和 REST API 提供有关 Apache Spark 应用程序运行信息的丰富指标数据。可以通过 Prometheus API 和 REST API 收集应用程序相关的指标数据。 并构建适合你的需求的诊断和监视工具。