将时序见解 Gen2 迁移到 Microsoft Fabric 中的实时智能
注意
时序见解服务将于 2024 年 7 月 7 日停用。 请考虑尽快将现有环境迁移到备用解决方案。 有关弃用和迁移的详细信息,请访问我们的文档。
概述
Eventhouse 是实时智能中的时序数据库。 它可以作为从时序见解迁移数据的目标。
概略性迁移建议。
| 功能 | 建议的迁移 |
|---|---|
| 通过平展和转义从中心引入 JSON | 从 Azure 事件中心获取数据 |
| 打开冷存储 | Eventhouse OneLake 可用性 |
| Power BI 连接器 | 使用 Eventhouse Power BI 连接器。 手动将 TSQ 重写为 KQL。 |
| Spark 连接器 | 将数据迁移到 Eventhouse。 将笔记本与 Apache Spark 配合使用以查询 Eventhouse 或通过笔记本浏览 lakehouse 中的数据 |
| 批量上传 | 从 Azure 存储获取数据 |
| 时序模型 | 可以导出为 JSON 文件。 可以导入到 Eventhouse。 Kusto 图形语义允许以图形形式对时间序列模型层次结构进行建模、遍历和分析 |
| 时序资源管理器 | 实时仪表板、Power BI 报表或使用 KustoTrender 编写自定义仪表板 |
| 查询语言 | 重写 KQL 中的查询。 |
迁移遥测
使用存储帐户中的 PT=Time 文件夹检索环境中所有数据的副本。 有关详细信息,请参阅数据存储。
迁移步骤 1 - 获取有关遥测数据的统计信息
数据
- 环境概述
- 记录数据访问 FQDN 第一部分中的环境 ID(例如,.env.crystal-dev.windows-int.net 中的 d390b0b0-1445-4c0c-8365-68d6382c1c2a)
- 环境概述- > 存储配置- > 存储帐户
- 使用存储资源管理器获取文件夹统计信息
- 记录
PT=Time文件夹的大小和 Blob 数。
- 记录
迁移步骤 2 - 将数据迁移到 Eventhouse
创建 Eventhouse
若要为迁移过程设置 Eventhouse,请按照创建 Eventhouse 中的步骤操作。
数据提取
若要检索与时序见解实例对应的存储帐户的数据,请按照从 Azure 存储获取数据中的步骤进行操作。
请确保:
将文件筛选器文件夹路径配置为
V=1/PT=Time以筛选相关的 Blob。验证推断的架构并移除任何不经常查询的列,同时至少保留时间戳、TSID 列和值。 为了确保将所有数据都复制到 Eventhouse,请添加另一列并使用 DropMappedFields 映射转换。
完成引入过程。
查询数据
成功引入数据后,可以使用 KQL 查询集开始浏览数据。 如果需要从自定义客户端应用程序访问数据,Eventhouse 为主要编程语言提供了 SDK,如 C#(链接)、Java(链接)和 Node.js(链接)。
将时序模型迁移到 Azure 数据资源管理器
使用 TSI 资源管理器 UX 或 TSM 批处理 API,可以从 TSI 环境下载 JSON 格式的模型。 然后,可以将模型导入到 Eventhouse。
从 TSI UX 下载 TSM。
使用 Visual Studio Code 或其他编辑器删除前三行。
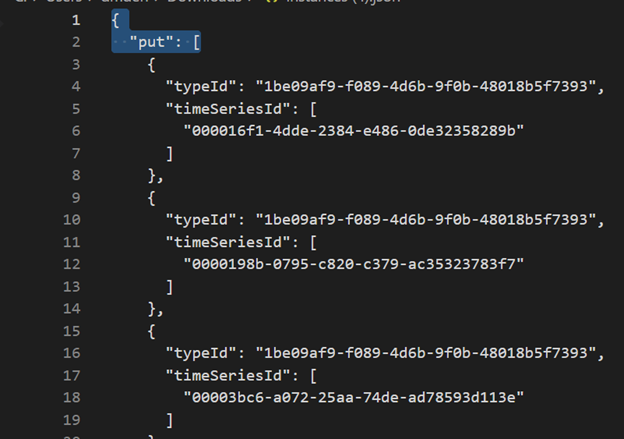
使用 Visual Studio Code 或另一个编辑器,搜索正则表达式
\},\n \{并将其替换为}{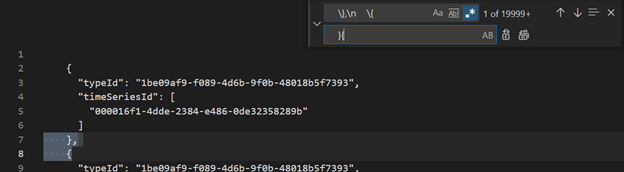
使用从单个文件中获取数据将 JSON 作为单独的表引入 ADX。


将时序数据迁移到 Fabric 实时智能中的 Eventhouse 后,可以使用 Kusto Graph 语义的强大功能对数据进行上下文化处理并分析数据。 Kusto 图形语义允许你以图形的形式对时间序列模型的层次结构进行建模、遍历和分析。 通过使用 Kusto 图形语义,可以深入了解时序数据中不同实体之间的关系,例如资产、站点和数据点。 这些见解可帮助你了解系统的各个组件之间的依赖关系和交互。
将时序查询 (TSQ) 转换为 KQL
GetEvents
{
  "getEvents": {
    "timeSeriesId": [
      "assest1",
      "siteId1",
      "dataId1"
    ],
    "searchSpan": {
      "from": "2021-11-01T00:00:0.0000000Z",
      "to": "2021-11-05T00:00:00.000000Z"
    },
    "inlineVariables": {},
  }
}
events
| where timestamp >= datetime(2021-11-01T00:00:0.0000000Z) and timestamp < datetime(2021-11-05T00:00:00.000000Z)
| where assetId_string == "assest1" and siteId_string == "siteId1" and dataid_string == "dataId1"
| take 10000
带筛选器的 GetEvents
{
  "getEvents": {
    "timeSeriesId": [
      "deviceId1",
      "siteId1",
      "dataId1"
    ],
    "searchSpan": {
      "from": "2021-11-01T00:00:0.0000000Z",
      "to": "2021-11-05T00:00:00.000000Z"
    },
    "filter": {
      "tsx": "$event.sensors.sensor.String = 'status' AND $event.sensors.unit.String = 'ONLINE"
    }
  }
}
events
| where timestamp >= datetime(2021-11-01T00:00:0.0000000Z) and timestamp < datetime(2021-11-05T00:00:00.000000Z)
| where deviceId_string== "deviceId1" and siteId_string == "siteId1" and dataId_string == "dataId1"
| where ['sensors.sensor_string'] == "status" and ['sensors.unit_string'] == "ONLINE"
| take 10000
带投影变量的 GetEvents
{
  "getEvents": {
    "timeSeriesId": [
      "deviceId1",
      "siteId1",
      "dataId1"
    ],
    "searchSpan": {
      "from": "2021-11-01T00:00:0.0000000Z",
      "to": "2021-11-05T00:00:00.000000Z"
    },
    "inlineVariables": {},
    "projectedVariables": [],
    "projectedProperties": [
      {
        "name": "sensors.value",
        "type": "String"
      },
      {
        "name": "sensors.value",
        "type": "bool"
      },
      {
        "name": "sensors.value",
        "type": "Double"
      }
    ]
  }
}
events
| where timestamp >= datetime(2021-11-01T00:00:0.0000000Z) and timestamp < datetime(2021-11-05T00:00:00.000000Z)
| where deviceId_string== "deviceId1" and siteId_string == "siteId1" and dataId_string == "dataId1"
| take 10000
| project timestamp, sensorStringValue= ['sensors.value_string'], sensorBoolValue= ['sensors.value_bool'], sensorDoublelValue= ['sensors.value_double']
AggregateSeries
{
  "aggregateSeries": {
    "timeSeriesId": [
      "deviceId1"
    ],
    "searchSpan": {
      "from": "2021-11-01T00:00:00.0000000Z",
      "to": "2021-11-05T00:00:00.0000000Z"
    },
    "interval": "PT1M",
    "inlineVariables": {
      "sensor": {
        "kind": "numeric",
        "value": {
          "tsx": "coalesce($event.sensors.value.Double, todouble($event.sensors.value.Long))"
        },
        "aggregation": {
          "tsx": "avg($value)"
        }
      }
    },
    "projectedVariables": [
      "sensor"
    ]
  }
events
| where timestamp >= datetime(2021-11-01T00:00:00.0000000Z) and timestamp < datetime(2021-11-05T00:00:00.0000000Z)
| where  deviceId_string == "deviceId1"
| summarize avgSensorValue= avg(coalesce(['sensors.value_double'], todouble(['sensors.value_long']))) by bin(IntervalTs = timestamp, 1m)
| project IntervalTs, avgSensorValue
带筛选器的 AggregateSeries
{
  "aggregateSeries": {
    "timeSeriesId": [
      "deviceId1"
    ],
    "searchSpan": {
      "from": "2021-11-01T00:00:00.0000000Z",
      "to": "2021-11-05T00:00:00.0000000Z"
    },
    "filter": {
      "tsx": "$event.sensors.sensor.String = 'heater' AND $event.sensors.location.String = 'floor1room12'"
    },
    "interval": "PT1M",
    "inlineVariables": {
      "sensor": {
        "kind": "numeric",
        "value": {
          "tsx": "coalesce($event.sensors.value.Double, todouble($event.sensors.value.Long))"
        },
        "aggregation": {
          "tsx": "avg($value)"
        }
      }
    },
    "projectedVariables": [
      "sensor"
    ]
  }
}
events
| where timestamp >= datetime(2021-11-01T00:00:00.0000000Z) and timestamp < datetime(2021-11-05T00:00:00.0000000Z)
| where  deviceId_string == "deviceId1"
| where ['sensors.sensor_string'] == "heater" and ['sensors.location_string'] == "floor1room12"
| summarize avgSensorValue= avg(coalesce(['sensors.value_double'], todouble(['sensors.value_long']))) by bin(IntervalTs = timestamp, 1m)
| project IntervalTs, avgSensorValue
Power BI
迁移基于时序见解的 Power BI 报表没有自动化过程。 依赖于时序见解中存储的数据的所有查询都必须迁移到 Eventhouse。
若要在 Power BI 中创建高效的时序报表,建议参考以下信息性博客文章:
- Power BI 中的 Eventhouse 时序功能
- 如何在不受大多数限制的情况下使用 M 动态参数
- KQL、Power Query 和 Power BI 中的时间跨度/持续时间值
- Power BI 中的 KQL 查询设置
- 按照当地时间筛选和可视化 Kusto 数据
- PBI + Kusto 中的准实时报表
- 使用 ADX 进行 Power BI 建模 - 速查表
有关在 Power BI 中创建有效的时序报表的指导,请参阅这些资源。
实时仪表板
Fabric 中的实时仪表板是磁贴的集合,可选择按页面进行组织,其中每个磁贴都有一个基础查询和一个可视化表示形式。 可以将 Kusto 查询语言 (KQL) 查询作为视觉对象以原生方式导出到仪表板,然后根据需要修改其基础查询和视觉对象格式设置。 除了便于数据浏览外,这种完全集成的仪表板体验还提供改进的查询和可视化效果性能。
首先,在 Fabric 实时智能中创建新的仪表板。 借助此功能,可以浏览数据、自定义视觉对象、应用条件格式以及利用参数。 此外,可以直接在实时仪表板中创建警报,从而增强监视功能。 有关如何创建仪表板的详细说明,请参阅官方文档。